| INE Birth Registry Source | ||
| Guatemala vital statistics, births by month, department, and sex | ||
| Year | Source File | Coverage |
|---|---|---|
| 2019 | ine_nacimientos_2019_2023.parquet | Births by month, department, and sex |
| 2020 | ine_nacimientos_2019_2023.parquet | Births by month, department, and sex |
| 2021 | ine_nacimientos_2019_2023.parquet | Births by month, department, and sex |
| 2022 | ine_nacimientos_2019_2023.parquet | Births by month, department, and sex |
| 2023 | ine_nacimientos_2019_2023.parquet | Births by month, department, and sex |
Estimate Age in Months
Module 1: Nutrient Intakes
Why Estimate Age in Months?
ENCOVI 2023 records age as integer years, which creates two methodological limitations for the biofortification impact analysis:
Loss of the 6-11 month population — Children reported as
edad == 0cannot be separated into those under 6 months (excluded due to exclusive breastfeeding) and those aged 6-11 months (part of the study population). Without month-level resolution, as shown in Table 4, the entire age-0 cohort must be excluded, losing the children aged 6-11 months who should be included.Imprecision in anthropometric modeling — WHO LMS growth reference tables require age in months. Using integer years introduces up to ±5.5 months of error in a range where growth curves have steep gradients, distorting height-for-age Z-score calculations.
This module resolves both limitations by generating a synthetic edad_meses variable using empirical birth distributions from the Guatemala National Statistics Institute (INE) vital statistics registry (2019-2023) (Instituto Nacional de Estadística, 2024). Each birth-year cohort is matched to the corresponding age-in-years group. Month assignment uses a greedy quota-filling algorithm that distributes children to birth months so that the survey-weighted distribution matches the observed INE proportions by department and sex.
Data Sources
The INE publishes annual vital statistics with births disaggregated by month of occurrence, department of maternal residence, and sex. Five years of data (2019-2023) are loaded and standardized to construct department- and sex-specific birth seasonality profiles.
Each birth year maps to one ENCOVI age cohort: children aged 0 years were born in 2023, aged 1 in 2022, and so on through age 4 (born 2019). This one-to-one mapping allows the INE distributions to serve as population-level reference weights for synthetic month assignment within each cohort.
NoteData Structure
The unified registry consolidates five annual INE releases (2019-2023) into a single table of births by year, month, department, and sex. Records classified as “Extranjero” or “Ignorado” are excluded from proportion calculations, as ENCOVI assigns all children to one of the 22 departments.
The table above documents the documentary coverage of the unified birth registry: five birth years (2019-2023), each mapping to one ENCOVI age cohort, consolidated into a single source providing births by month, department, and sex.
| Birth Registry Data Summary | ||||
| INE Guatemala vital statistics (2019-2023)1 | ||||
| Year | Records2 | Departments | Months | Total Births |
|---|---|---|---|---|
| 2019 | 528 | 22 | 12 | 366,448 |
| 2020 | 528 | 22 | 12 | 340,876 |
| 2021 | 528 | 22 | 12 | 344,746 |
| 2022 | 528 | 22 | 12 | 345,359 |
| 2023 | 528 | 22 | 12 | 331,510 |
| 1 Red cells indicate deviations from expected values. | ||||
| 2 Expected: 22 departments x 12 months x 2 sexes = 528 records per year. | ||||
TipData Completeness
All five years contain exactly 528 records (22 departments × 12 months × 2 sexes), matching the expected record grid for the vital statistics registry. Total annual births range from approximately 331,000 to 366,000 across the period.
Birth Seasonality Patterns
Before using INE birth proportions for month assignment, we verify that birth timing carries meaningful departmental and sex-specific variation beyond a uniform distribution. If births were uniformly distributed, each month would contain 8.33% (1/12) of annual births.
| Birth Proportion Validation | |||||
| Sum of monthly proportions by year (expected = 1.000 per stratum) | |||||
| Year | Strata (dept x sex) | Min Sum | Max Sum | Mean Sum | All Valid |
|---|---|---|---|---|---|
| 2019 | 44 | 1.0000 | 1.0000 | 1.0000 | TRUE |
| 2020 | 44 | 1.0000 | 1.0000 | 1.0000 | TRUE |
| 2021 | 44 | 1.0000 | 1.0000 | 1.0000 | TRUE |
| 2022 | 44 | 1.0000 | 1.0000 | 1.0000 | TRUE |
| 2023 | 44 | 1.0000 | 1.0000 | 1.0000 | TRUE |
Within each (year × department × sex) stratum the monthly proportions sum to 1, which is the structural condition the quota-based assignment algorithm operates on.
Departmental Patterns
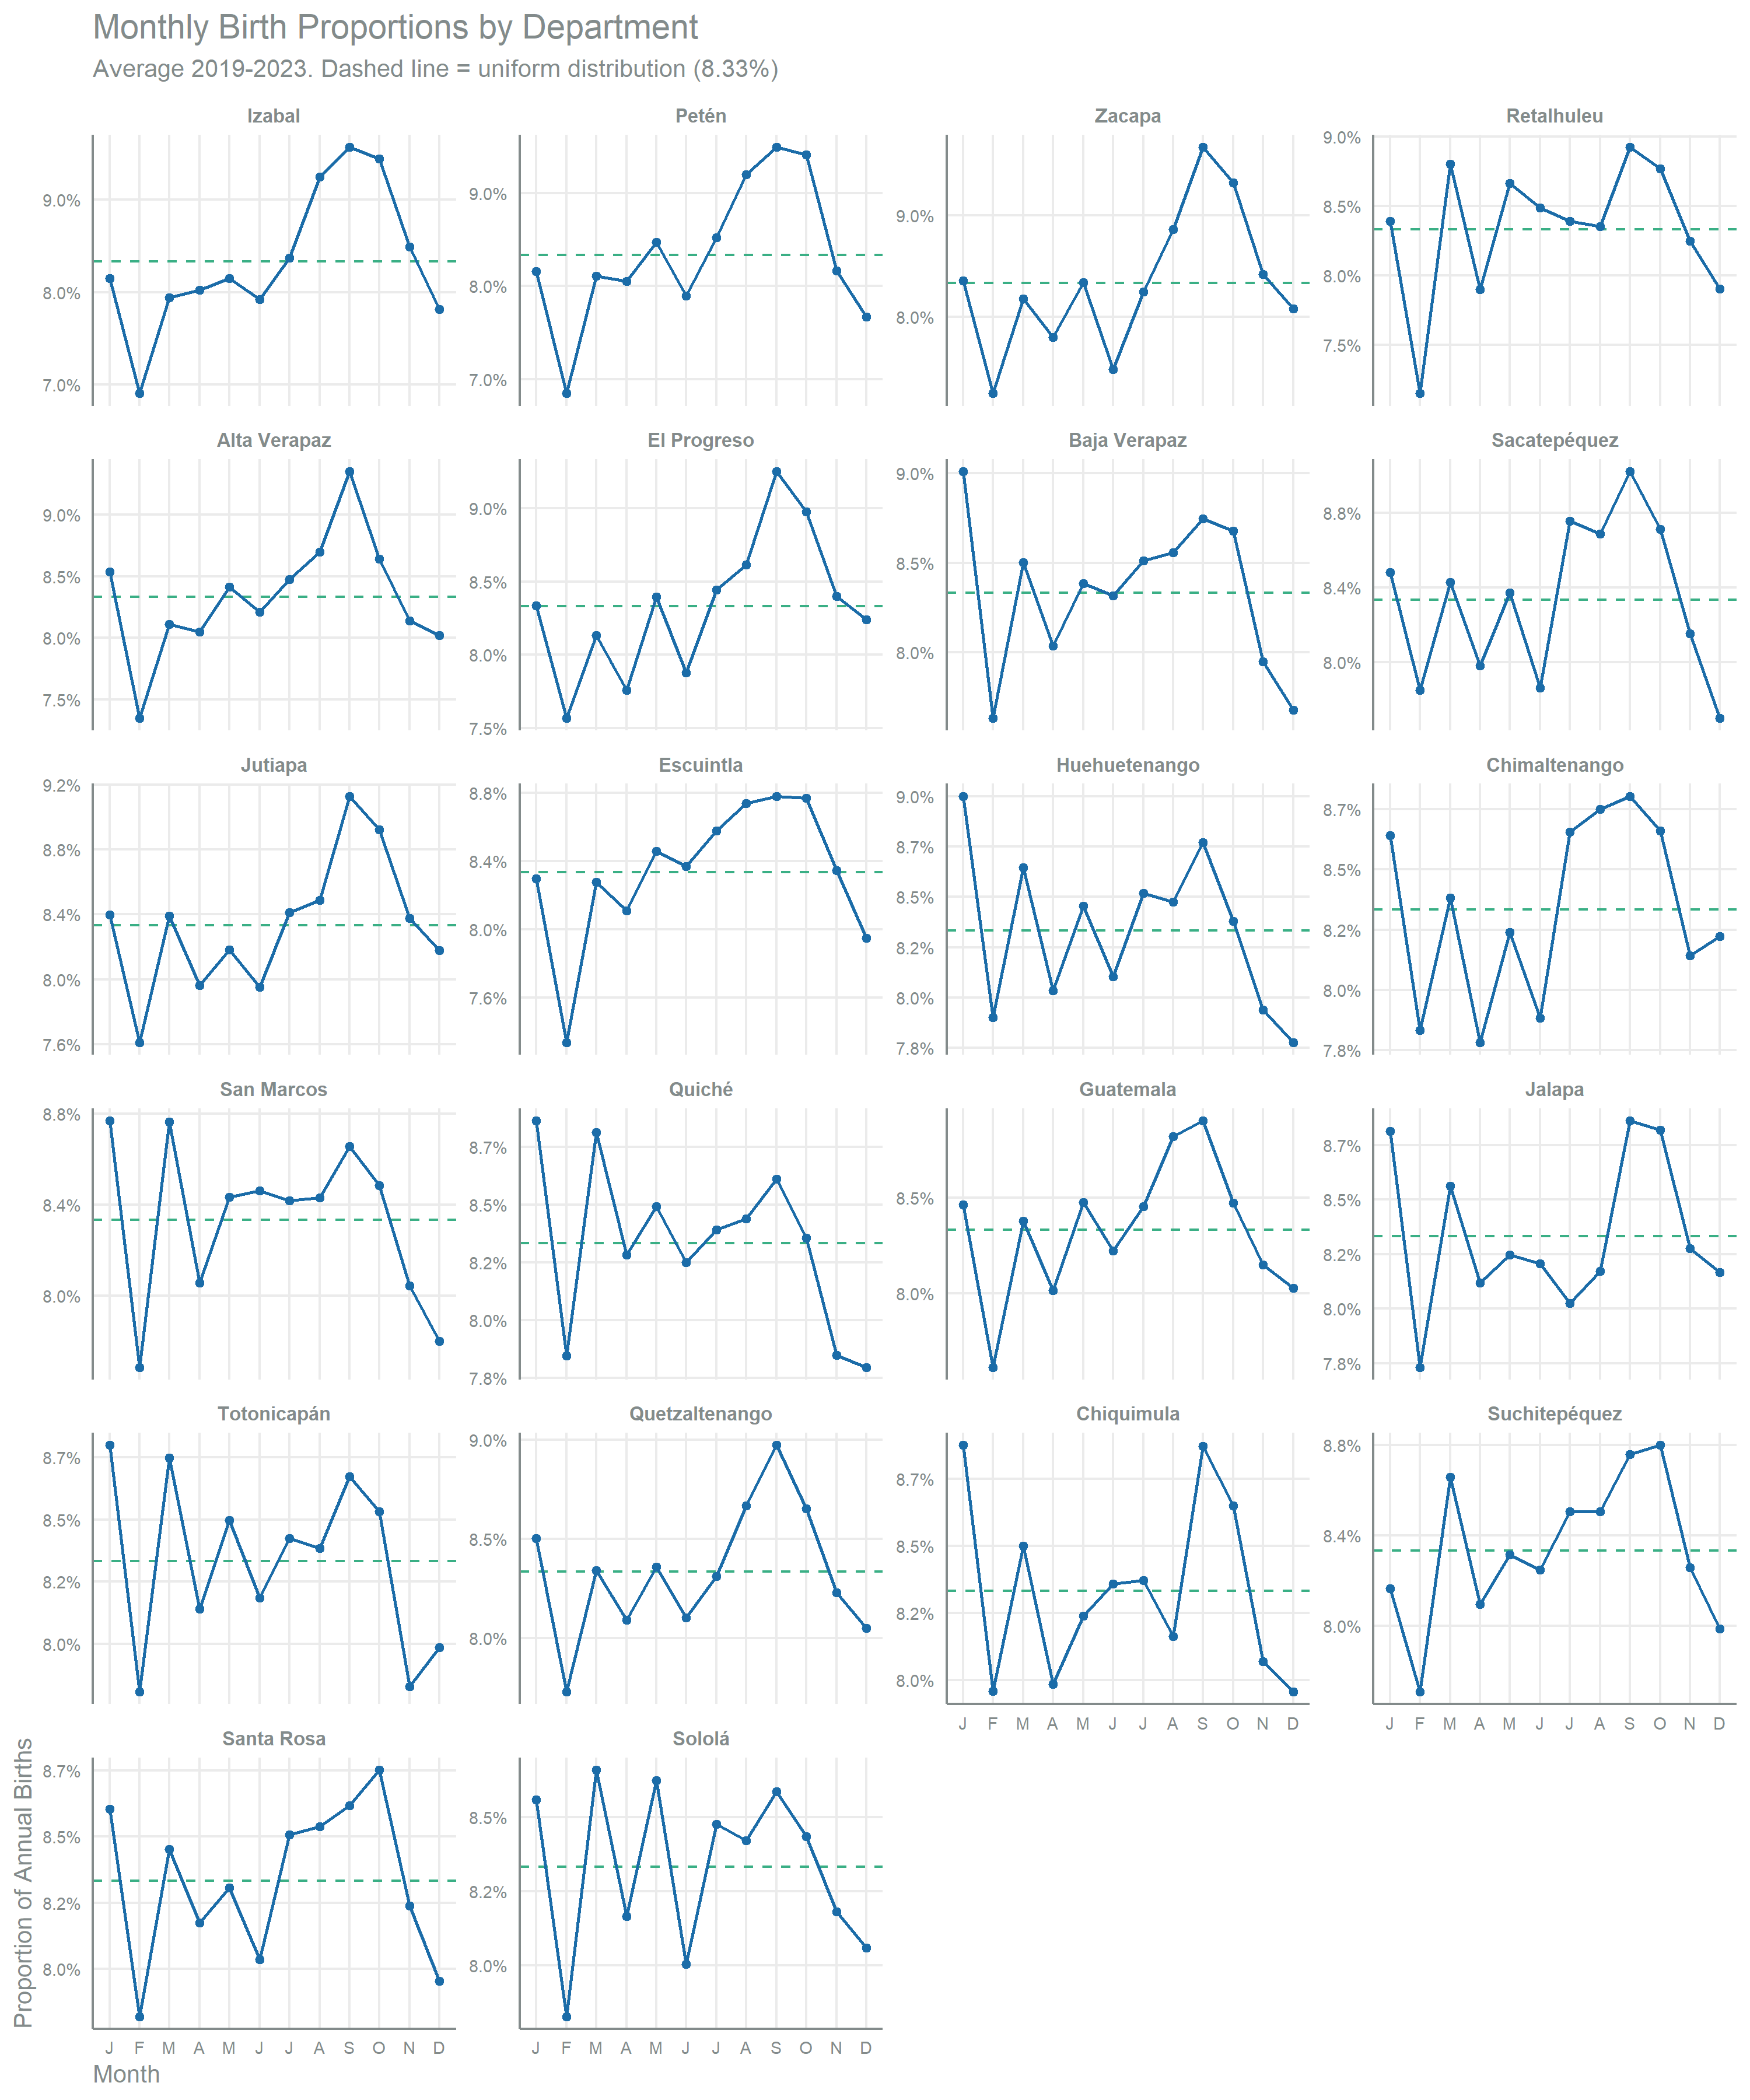
All 22 departments show seasonal patterns that depart from the uniform distribution (dashed green line), with most departments exhibiting a trough in November-December and peaks in the first quarter of the year. The month assignment therefore draws on department-specific empirical proportions.
Sex Differential
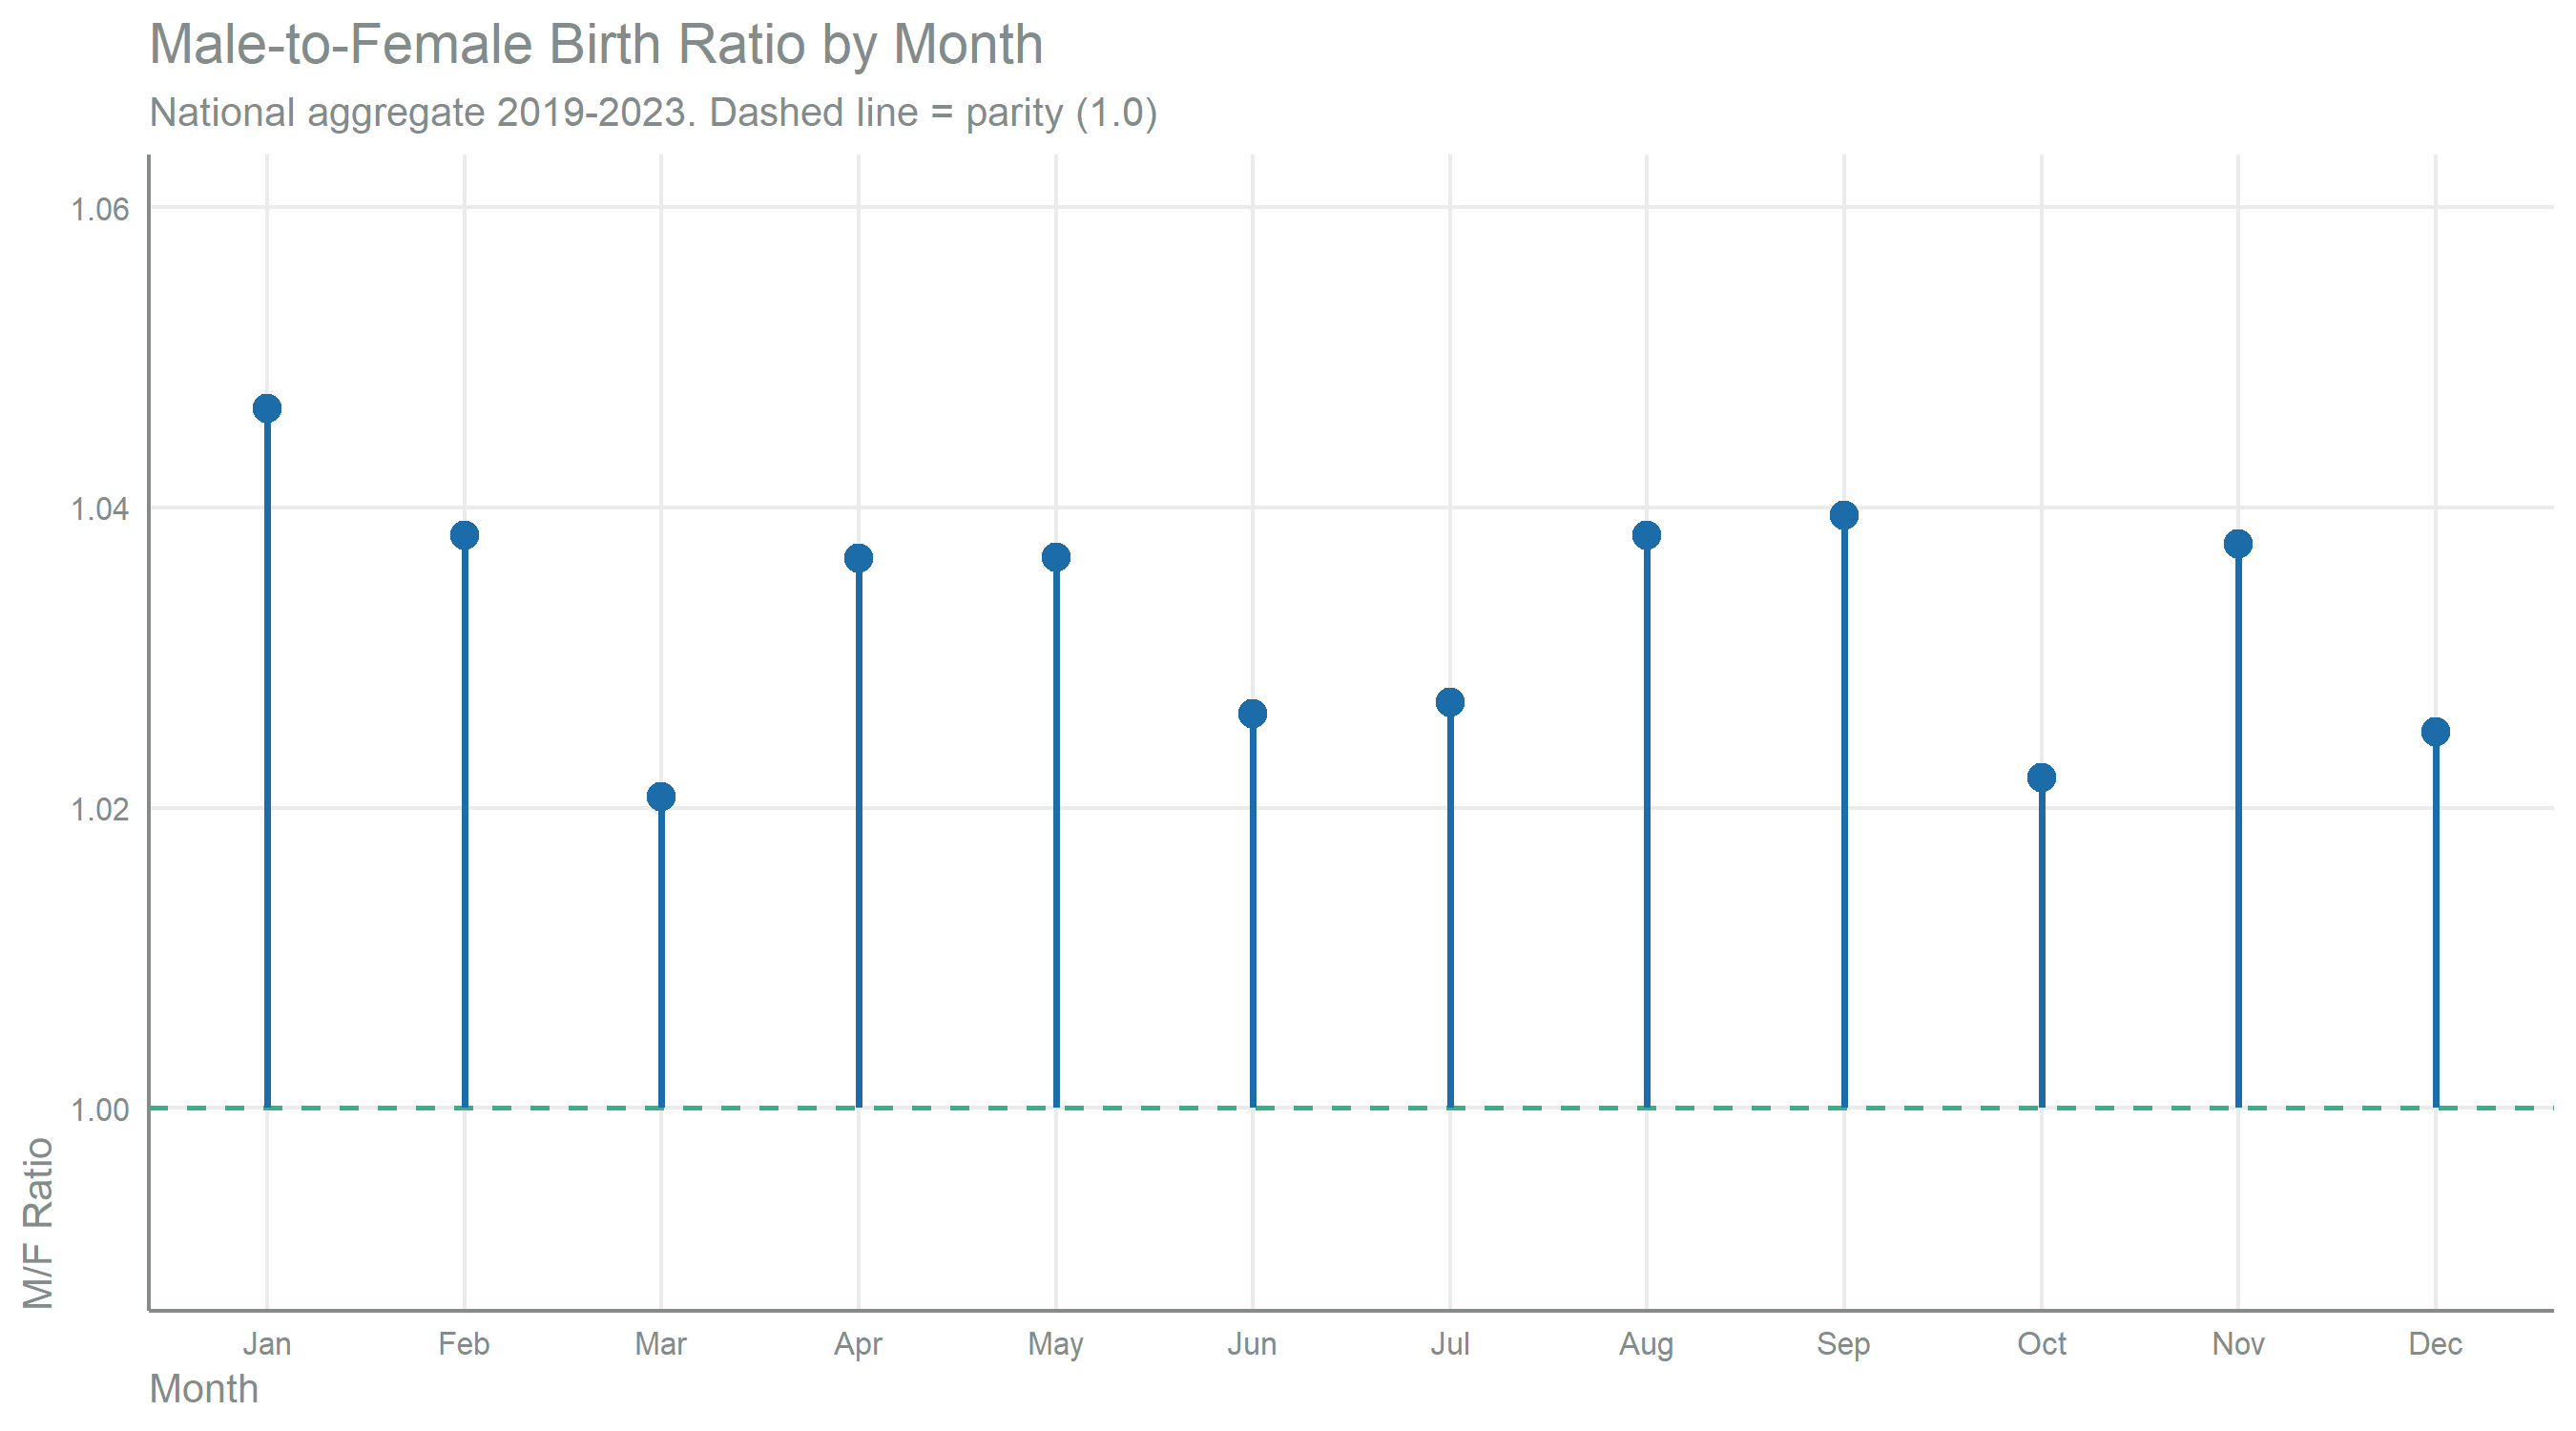
The male-to-female birth ratio exceeds parity in every month (range: 1.02-1.05), consistent with the documented global biological excess of male births. This sex differential, combined with departmental seasonality, is why the month assignment is conditioned on both department and sex.
ENCOVI Children and Cohort Mapping
Target Population
ENCOVI 2023 contains 4,725 children aged 0-4 years, distributed across five single-year age groups. These children form the population requiring synthetic month assignment.
| Children Aged 0-4 Years in ENCOVI 2023 | ||||
| Distribution by age (integer years) and sex before month assignment (sampled children, unweighted) | ||||
| Age (years) | Male | Female | Total | |
|---|---|---|---|---|
| 0 | 480 | 446 | 926 | |
| 1 | 446 | 435 | 881 | |
| 2 | 488 | 453 | 941 | |
| 3 | 458 | 433 | 891 | |
| 4 | 559 | 527 | 1,086 | |
| Total | — | 2,431 | 2,294 | 4,725 |
Cohort Mapping Logic
Each integer age maps to a single birth-year cohort. A child aged n years was born in 2023 - n. Within each cohort, the 12 possible birth months define a 12-month age range.
| Cohort Mapping: ENCOVI Age to INE Birth Year | |||
| Each integer age maps to a birth year and 12-month range | |||
| Age (years) | Birth Year | Month Offset | Age Range (months) |
|---|---|---|---|
| 0 | 2023 | 0 | 0-11 |
| 1 | 2022 | 12 | 12-23 |
| 2 | 2021 | 24 | 24-35 |
| 3 | 2020 | 36 | 36-47 |
| 4 | 2019 | 48 | 48-59 |
NoteCohort Assignment Assumption
This mapping assumes children were interviewed during 2023 and that their reported age reflects completed years. For children interviewed near their birthday, the resulting imprecision is bounded at ±1 month within the cohort.
Synthetic Month Assignment
Assignment Algorithm
Within each stratum (birth year × department × sex), the algorithm distributes children to birth months using a greedy quota-filling approach:
- Calculate target population per month from INE proportions and total survey-weighted population in the stratum.
- Sort children by survey weight (descending), with random tie-breaking.
- Assign each child to the month with the largest remaining quota, subtracting the child’s weight from that month’s quota.
The survey-weighted (population-represented) distribution of assigned months therefore follows the INE reference proportions.
A child assigned birth month m within a given birth year receives edad_meses = month_offset + (12 - m), mapping January births to the oldest position within the cohort and December births to the youngest.
ImportantPopulation-Level Quota Matching
The algorithm operates on survey-weighted quotas. A department with 50 sampled children representing 5,000 individuals therefore produces a weighted distribution that follows INE proportions at the population level — the level at which results are reported. The greedy approach is quasi-deterministic: stochasticity is limited to tie-breaking among children with identical survey weights.
Biological Plausibility Correction
Within households containing multiple children aged 0-4 years, independent stratum-based assignment can produce age-in-months values that are biologically implausible for siblings. Two children from the same mother cannot be born less than 9 months apart unless they are twins (age difference of exactly 0 months).
The post-assignment correction identifies all sibling pairs where the assigned age separation falls in the invalid range (1-8 months) and reassigns the child with the smaller survey weight to the valid birth month with the largest remaining INE quota in that child’s stratum. The correction is iterative: after each reassignment, all sibling pairs within the household are re-evaluated.
Assignment Results
| Synthetic Age-in-Months Assignment Summary | |
| ENCOVI 2023 individual dataset | |
| Category | N |
|---|---|
| Total individuals in ENCOVI | 46,017 |
| Children 0-4 years (synthetic assignment) | 4,725 |
| Children under 1 year | 926 |
| Children 6-11 months (synthetic assignment) | 434 |
| Children 0-5 months (excluded, exclusive breastfeeding assumption) | 492 |
| Adults and older children (simple conversion) | 41,292 |
TipStudy Population Recovery
The synthetic month assignment identifies 434 children aged 6-11 months, who cannot be separated from infants under 6 months on integer age alone (both report edad == 0). This extends the study population to the intended 6-59 month range, covering the complementary feeding window.
Validation
Distributional Match to INE Proportions
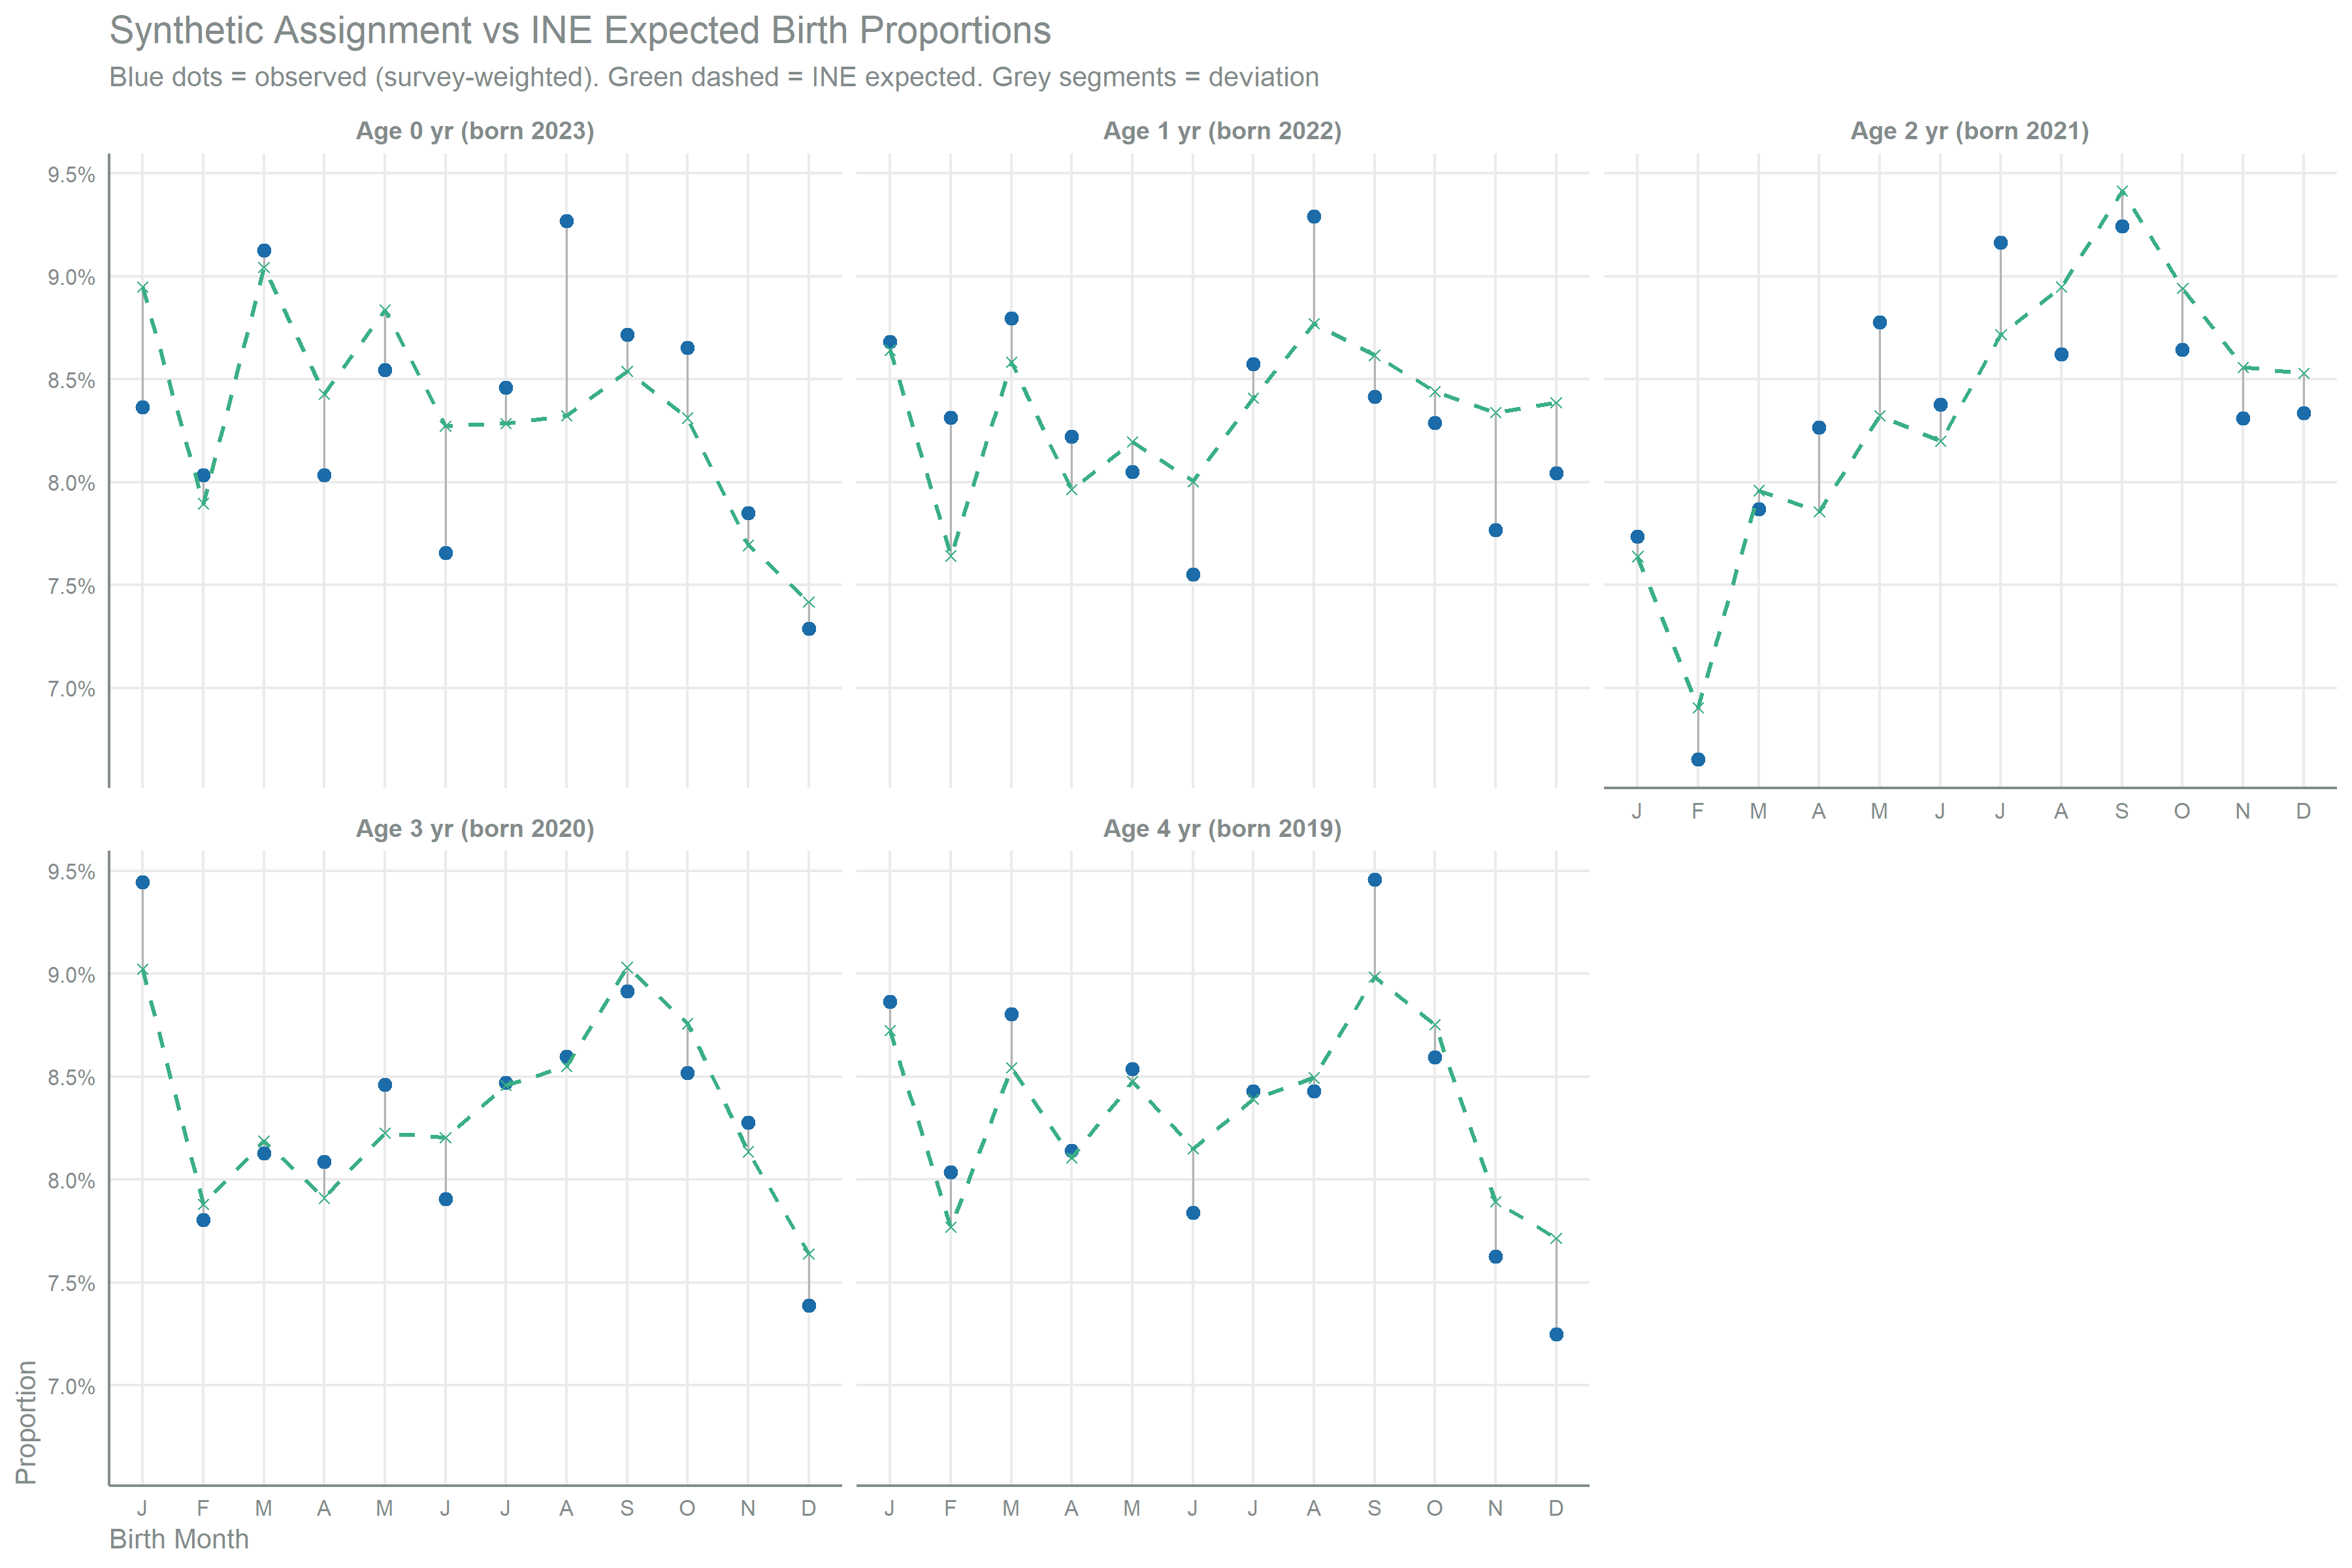
The primary validation compares the survey-weighted distribution of assigned birth months against the INE reference proportions for each cohort. Grey segments show the deviation between observed (blue dots) and expected (green crosses) proportions.
Age Distribution in Study Population
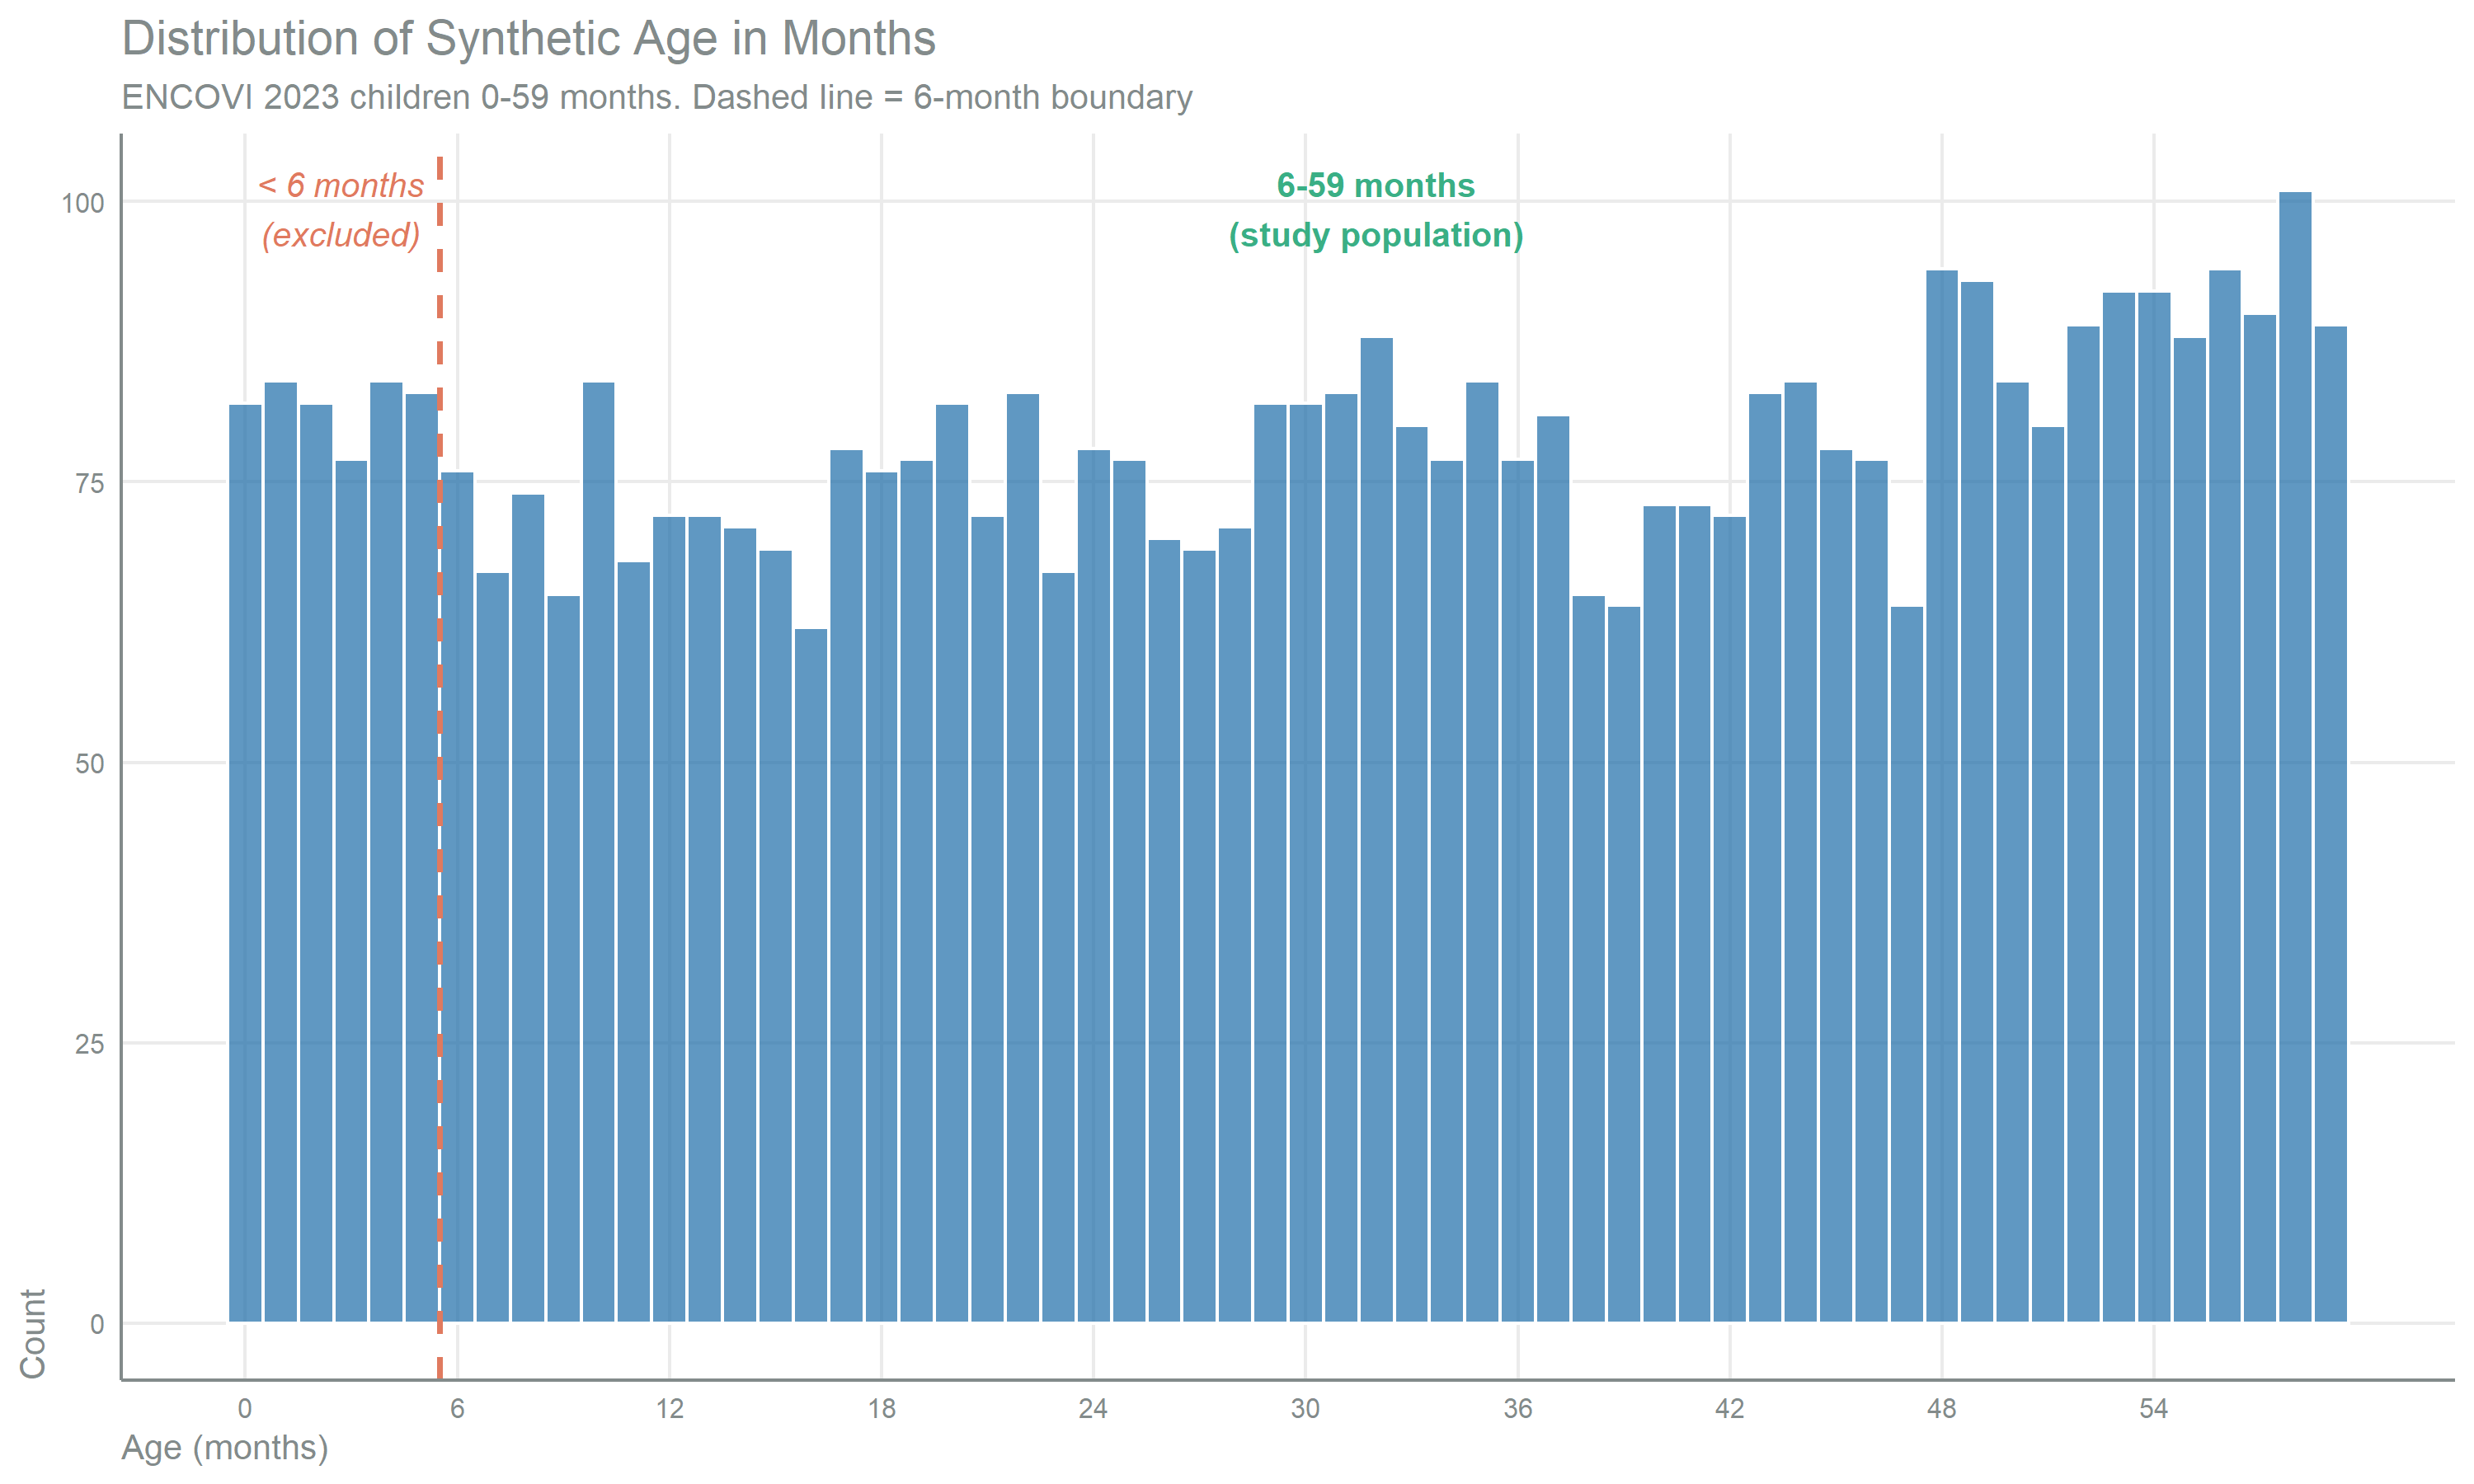
The histogram shows a relatively uniform distribution of age in months across the 0-59 range, consistent with approximately equal birth cohort sizes in ENCOVI. The 6-month boundary (dashed red line) clearly separates the excluded breastfeeding population from the study population.
Departmental Age Distribution
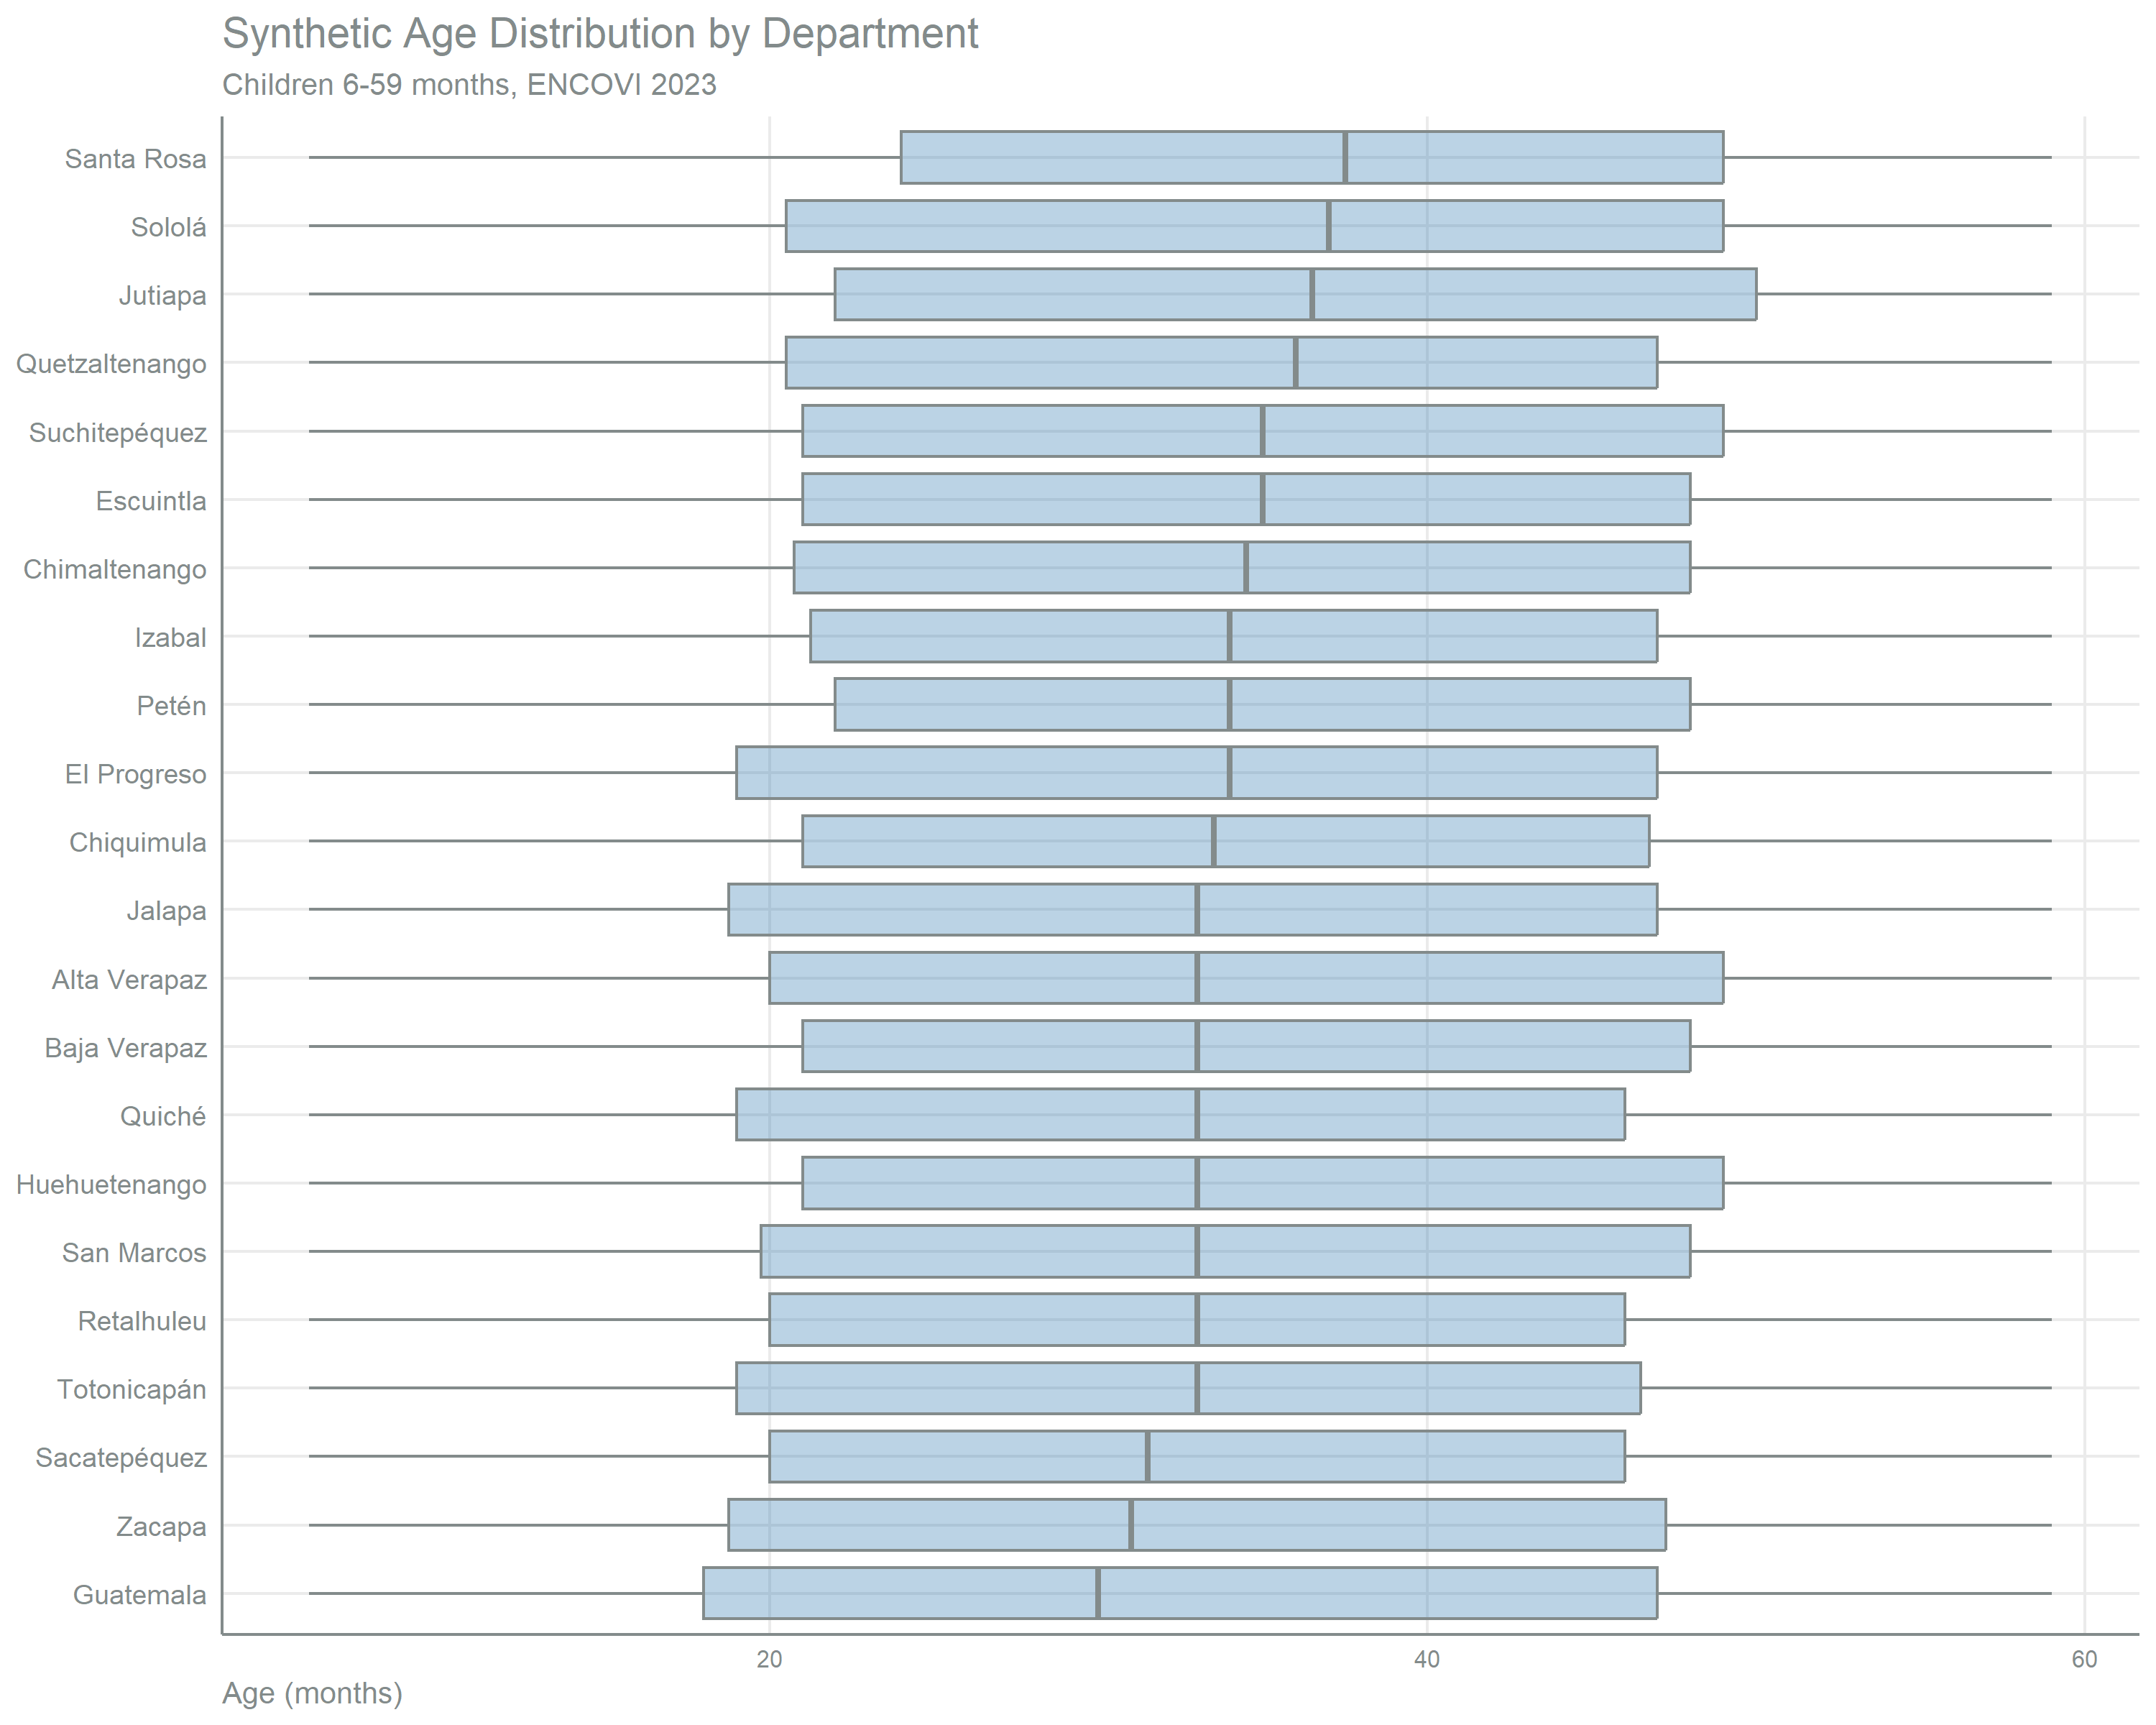
Departmental boxplots confirm that the synthetic age distribution is well-behaved across all 22 departments, with median ages centered around 30-40 months and comparable interquartile ranges. No department shows distributional anomalies that would suggest systematic assignment bias.
Weighted Deviation from INE Proportions
The primary quality metric quantifies the departure of the synthetic assignment from the target INE birth proportions. For each department, the mean and maximum absolute deviation are calculated across all cohort-month strata.
| Weighted Deviation from INE Birth Proportions | ||||
| By department, across all cohorts and months | ||||
| Department | N Children (sample) | Strata (cohort x month) | Mean |Deviation|1 | Max |Deviation| |
|---|---|---|---|---|
| Santa Rosa | 135 | 120 | 0.0157 | 0.0849 |
| Quetzaltenango | 204 | 120 | 0.0135 | 0.0664 |
| Zacapa | 175 | 120 | 0.0129 | 0.0423 |
| Sololá | 164 | 120 | 0.0129 | 0.0793 |
| El Progreso | 161 | 120 | 0.0122 | 0.1071 |
| Retalhuleu | 158 | 120 | 0.0116 | 0.0544 |
| Jutiapa | 191 | 120 | 0.0115 | 0.0611 |
| Chimaltenango | 234 | 120 | 0.0103 | 0.0509 |
| Huehuetenango | 238 | 120 | 0.0103 | 0.0412 |
| Chiquimula | 176 | 120 | 0.0100 | 0.0531 |
| Baja Verapaz | 226 | 120 | 0.0099 | 0.0505 |
| Escuintla | 237 | 120 | 0.0098 | 0.0455 |
| Totonicapán | 231 | 120 | 0.0096 | 0.0341 |
| Sacatepéquez | 186 | 120 | 0.0095 | 0.0576 |
| Izabal | 218 | 120 | 0.0091 | 0.0430 |
| Jalapa | 222 | 120 | 0.0086 | 0.0464 |
| Petén | 223 | 120 | 0.0086 | 0.0580 |
| San Marcos | 233 | 120 | 0.0078 | 0.0406 |
| Suchitepéquez | 251 | 120 | 0.0072 | 0.0397 |
| Alta Verapaz | 328 | 120 | 0.0071 | 0.0430 |
| Guatemala | 222 | 120 | 0.0070 | 0.0415 |
| Quiché | 312 | 120 | 0.0065 | 0.0257 |
| 1 Green = mean deviation <= 2pp. Red = exceeds 2pp. Higher deviations correlate with smaller sample sizes and the discrete nature of the assignment algorithm. Max deviation captures the worst individual stratum (single month x cohort combination). | ||||
TipAssignment Quality
All 22 departments achieve mean absolute deviations below 1.6 percentage points from the INE target proportions. The departments with the highest deviations are those with smaller sample sizes where the discrete nature of the assignment algorithm has a proportionally larger impact.
Sibling Age Separation
Sibling age separations are reported after the biological plausibility correction. Valid sibling pairs have an age difference of exactly 0 months (twins) or at least 9 months (minimum full gestation period).
| Sibling Age Separation Distribution | ||
| All sibling pairs in households with 2+ children aged 0-4 years, after biological plausibility correction | ||
| Separation Category | N Pairs | Proportion |
|---|---|---|
| Twins (0 months) | 71 | 6.0% |
| 9-12 months | 135 | 11.3% |
| 13-24 months | 370 | 31.0% |
| >24 months | 617 | 51.7% |
TipBiological Plausibility
After the correction, as shown in Table 8, no sibling pairs remain in the invalid 1-8 month separation range. The majority of pairs are separated by more than 24 months, consistent with typical inter-birth intervals in Guatemala. Approximately 71 pairs (6%) are classified as twins (0-month separation), inferred from the algorithm output rather than directly observed (ENCOVI does not record twin status).
Summary
Key Findings
Study population coverage: The synthetic month assignment identifies 434 children aged 6-11 months, extending the study population to the specified 6-59 month range.
Distributional accuracy: Survey-weighted month distributions track INE birth proportions with mean deviations below 1.6 percentage points in each of the 22 departments.
Biological consistency: As documented in Table 8, no sibling pair remains in the impossible 1-8 month separation range after the plausibility correction.
Seasonal information carried through: The assignment reproduces departmental and sex-specific birth seasonality.
WarningLimitations
Interview timing assumption — The lack of individual-level interview dates means cohort assignment is approximate. A child whose household was interviewed near the child’s birthday may be misclassified by one cohort. This ambiguity affects approximately 1/12 of children at each boundary.
Residual stochasticity — The assignment is quasi-deterministic, with a random component limited to tie-breaking among children with identical survey weights. Individual-level assignments are synthetic and should not be interpreted as observed values.
Twin identification — The pairs classified as twins (0-month separation, see Table 8) are inferred rather than observed, as ENCOVI does not record twin status.
Application
This dataset provides month-level age resolution for all ENCOVI 2023 individuals, enabling precise WHO LMS Z-score calculations in downstream anthropometric modeling. The synthetic edad_meses variable is used by subsequent scripts in both the Covariate prediction pathway (individual consumption allocation) and the Meta-analysis (Gunaratna) pathway (height-for-age Z-score computation).
References
Instituto Nacional de Estadística. (2024). Estadísticas Vitales — Nacimientos. Bases de Datos Anuales 2019–2023 [Dataset]. Instituto Nacional de Estadística. https://www.ine.gob.gt/vitales/