| Household Agricultural Vector Validation | |
| Mutual exclusivity check: Levels 1 + 2 + 3 = Total agricultural | |
| Level | N Households1 |
|---|---|
| Level 1: Maize + self-consumption | 1,158 |
| Level 2: Maize, no self-consumption | 41 |
| Level 3: Non-maize agriculture | 592 |
| Total agricultural households | 1,791 |
| Total in raw production data | 1,791 |
| 1 Counts refer to sampled households in ENCOVI 2023. | |
Biofortification Priority Assignment
Module 5: Meta-analysis
Why Assign Biofortification Priority?
Biofortified maize reaches different populations through different channels. Children in households that produce and consume their own maize are the most direct beneficiaries; children in non-agricultural urban households access biofortified varieties through progressively more indirect market mechanisms. This module assigns a five-level priority hierarchy to each child based on their household’s agricultural profile, determining the order in which children receive biofortified maize in scenario simulations.
Priority Hierarchy
| Level | Label | Definition |
|---|---|---|
| 1 | Maize farm + self-consumption | Produces white maize, retains for own consumption |
| 2 | Maize farm, no self-consumption | Produces white maize, sells entire harvest |
| 3 | Non-maize agricultural household | Agricultural production but no white maize |
| 4 | Rural non-agricultural | Rural household, no reported production |
| 5 | Urban | Urban household |
The hierarchy is constructed at the household level: children in the same household receive the same priority, since biofortified maize enters the household food supply as a whole.
Data Sources
Three datasets are integrated in the framework: the ENCOVI children with stunting profiles, the white maize farmer dataset with self-consumption flags built in the economic impact module for the 2022 seed, and the raw ENCOVI agricultural production module, covering all 82 crop types, which identifies the non-agricultural and non-maize agricultural households.
The hierarchy is built on the 2022 seed farmer dataset. Seed generation enters the economic projections and the adoption scores, and leaves the household-level agricultural profile unchanged: the two variables read here, no_hogar and has_household_consumption, take the same values for the 2022, 2026 and 2028 seeds. The priority assignment therefore serves every seed scenario.
Household Agricultural Classification
Three mutually exclusive household vectors are constructed based on agricultural activity. Level 1 identifies maize-producing households that retain harvest for consumption; Level 2 identifies maize producers who sell everything; Level 3 identifies households with other agricultural production but no white maize.
Vector Validation
NoteMutual Exclusivity
The three agricultural household vectors sum to the total number of agricultural households in the raw production data, 1,791, and their pairwise intersections are empty, so the classification covers the agricultural households once each. Level 1, maize with self-consumption, holds 1,158 households against 41 in Level 2, so 96.6% of maize-producing households retain part of their harvest.
| Mutual Exclusivity Verification | ||
| All intersections should be zero | ||
| Comparison | N Overlap | Status |
|---|---|---|
| Level 1 ∩ Level 2 | 0 | PASS |
| Level 1 ∩ Level 3 | 0 | PASS |
| Level 2 ∩ Level 3 | 0 | PASS |
Priority Assignment
Each child receives a priority level via strict hierarchical precedence: a child is assigned to the highest applicable level. Levels 4 and 5 are residual categories based on the area variable (Rural/Urbana) from the ENCOVI household module.
| Assignment Completeness Verification | |
| All checks should show 0 (except total children) | |
| Check | Value |
|---|---|
| Children with NA in priority_level | 0 |
| Children with NA in area | 0 |
| Children with NA in no_hogar | 0 |
| Total sampled children | 4,065 |
Distribution Analysis
National Distribution (Unweighted)
| Child Distribution by Biofortification Priority Level | |||||
| Unweighted sample counts — ENCOVI 2023 children aged 6–59 months | |||||
| Level | Description | Children | Households | % of Total | Cumulative % |
|---|---|---|---|---|---|
| 1 | Maize farm + self-consumption | 512 | 402 | 12.6% | 12.6% |
| 2 | Maize farm, no self-consumption | 10 | 9 | 0.2% | 12.8% |
| 3 | Non-maize agricultural household | 295 | 232 | 7.3% | 20.1% |
| 4 | Rural non-agricultural | 1,670 | 1,320 | 41.1% | 61.2% |
| 5 | Urban | 1,578 | 1,321 | 38.8% | 100.0% |
National Distribution (Survey-Weighted)
| Child Distribution by Biofortification Priority Level | ||||||
| Survey-weighted population estimates — ENCOVI 2023 children aged 6–59 months | ||||||
| Level | Description | Population Estimate | 95% CI Lower | 95% CI Upper | % of Total | Cumulative % |
|---|---|---|---|---|---|---|
| 1 | Maize farm + self-consumption | 188,724 | 157,138 | 220,309 | 12.4% | 12.4% |
| 2 | Maize farm, no self-consumption | 3,905 | 1,055 | 6,755 | 0.3% | 12.7% |
| 3 | Non-maize agricultural household | 130,945 | 104,211 | 157,680 | 8.6% | 21.3% |
| 4 | Rural non-agricultural | 578,911 | 519,376 | 638,446 | 38.0% | 59.3% |
| 5 | Urban | 620,077 | 553,161 | 686,993 | 40.7% | 100.0% |
ImportantPopulation Structure
At the population level, 12.4% of children aged 6-59 months live in households that produce and consume their own maize (Level 1). An additional 0.3% live in maize-producing households without self-consumption (Level 2), and 8.6% in non-maize agricultural households (Level 3). The first three levels, which carry the most direct access to biofortified varieties, cover 21.3% of the child population, so around four in five children are reached through the market channels of Levels 4 and 5 (see Table 5).
Departmental Distribution
| Departmental Distribution of Children by Priority Level | |||||
| Survey-weighted percentage within each department | |||||
| Department | L1: Maize + SC1 | L2: Maize, no SC1 | L3: Non-maize Ag.1 | L4: Rural1 | L5: Urban1 |
|---|---|---|---|---|---|
| Alta Verapaz | 21.7% | 1.3% | 10.9% | 42.4% | 23.8% |
| Baja Verapaz | 12.2% | 0.0% | 24.7% | 41.6% | 21.4% |
| Chimaltenango | 14.3% | 0.4% | 5.8% | 34.4% | 45.0% |
| Chiquimula | 28.5% | 0.0% | 8.1% | 49.2% | 14.1% |
| El Progreso | 1.1% | 0.0% | 1.1% | 36.3% | 61.4% |
| Escuintla | 4.0% | 0.4% | 2.6% | 31.8% | 61.2% |
| Guatemala | 1.0% | 0.0% | 1.0% | 8.8% | 89.3% |
| Huehuetenango | 19.8% | 0.0% | 20.6% | 37.3% | 22.3% |
| Izabal | 18.6% | 1.0% | 4.4% | 39.3% | 36.6% |
| Jalapa | 10.4% | 0.0% | 15.8% | 36.9% | 36.9% |
| Jutiapa | 22.4% | 1.7% | 4.0% | 41.7% | 30.2% |
| Petén | 21.6% | 0.0% | 0.9% | 52.0% | 25.4% |
| Quetzaltenango | 8.7% | 0.0% | 11.2% | 38.5% | 41.5% |
| Quiché | 14.9% | 0.0% | 10.1% | 45.7% | 29.2% |
| Retalhuleu | 2.7% | 0.0% | 2.1% | 35.1% | 60.1% |
| Sacatepéquez | 1.9% | 0.4% | 1.2% | 19.8% | 76.7% |
| San Marcos | 12.2% | 0.0% | 13.7% | 52.4% | 21.7% |
| Santa Rosa | 8.4% | 0.0% | 0.0% | 44.9% | 46.7% |
| Sololá | 2.2% | 0.0% | 4.6% | 37.7% | 55.5% |
| Suchitepéquez | 7.0% | 0.5% | 1.8% | 45.9% | 44.8% |
| Totonicapán | 8.7% | 0.0% | 11.5% | 43.3% | 36.4% |
| Zacapa | 11.4% | 0.0% | 3.7% | 55.2% | 29.7% |
| 1 SC = self-consumption. Ag. = agricultural household. | |||||
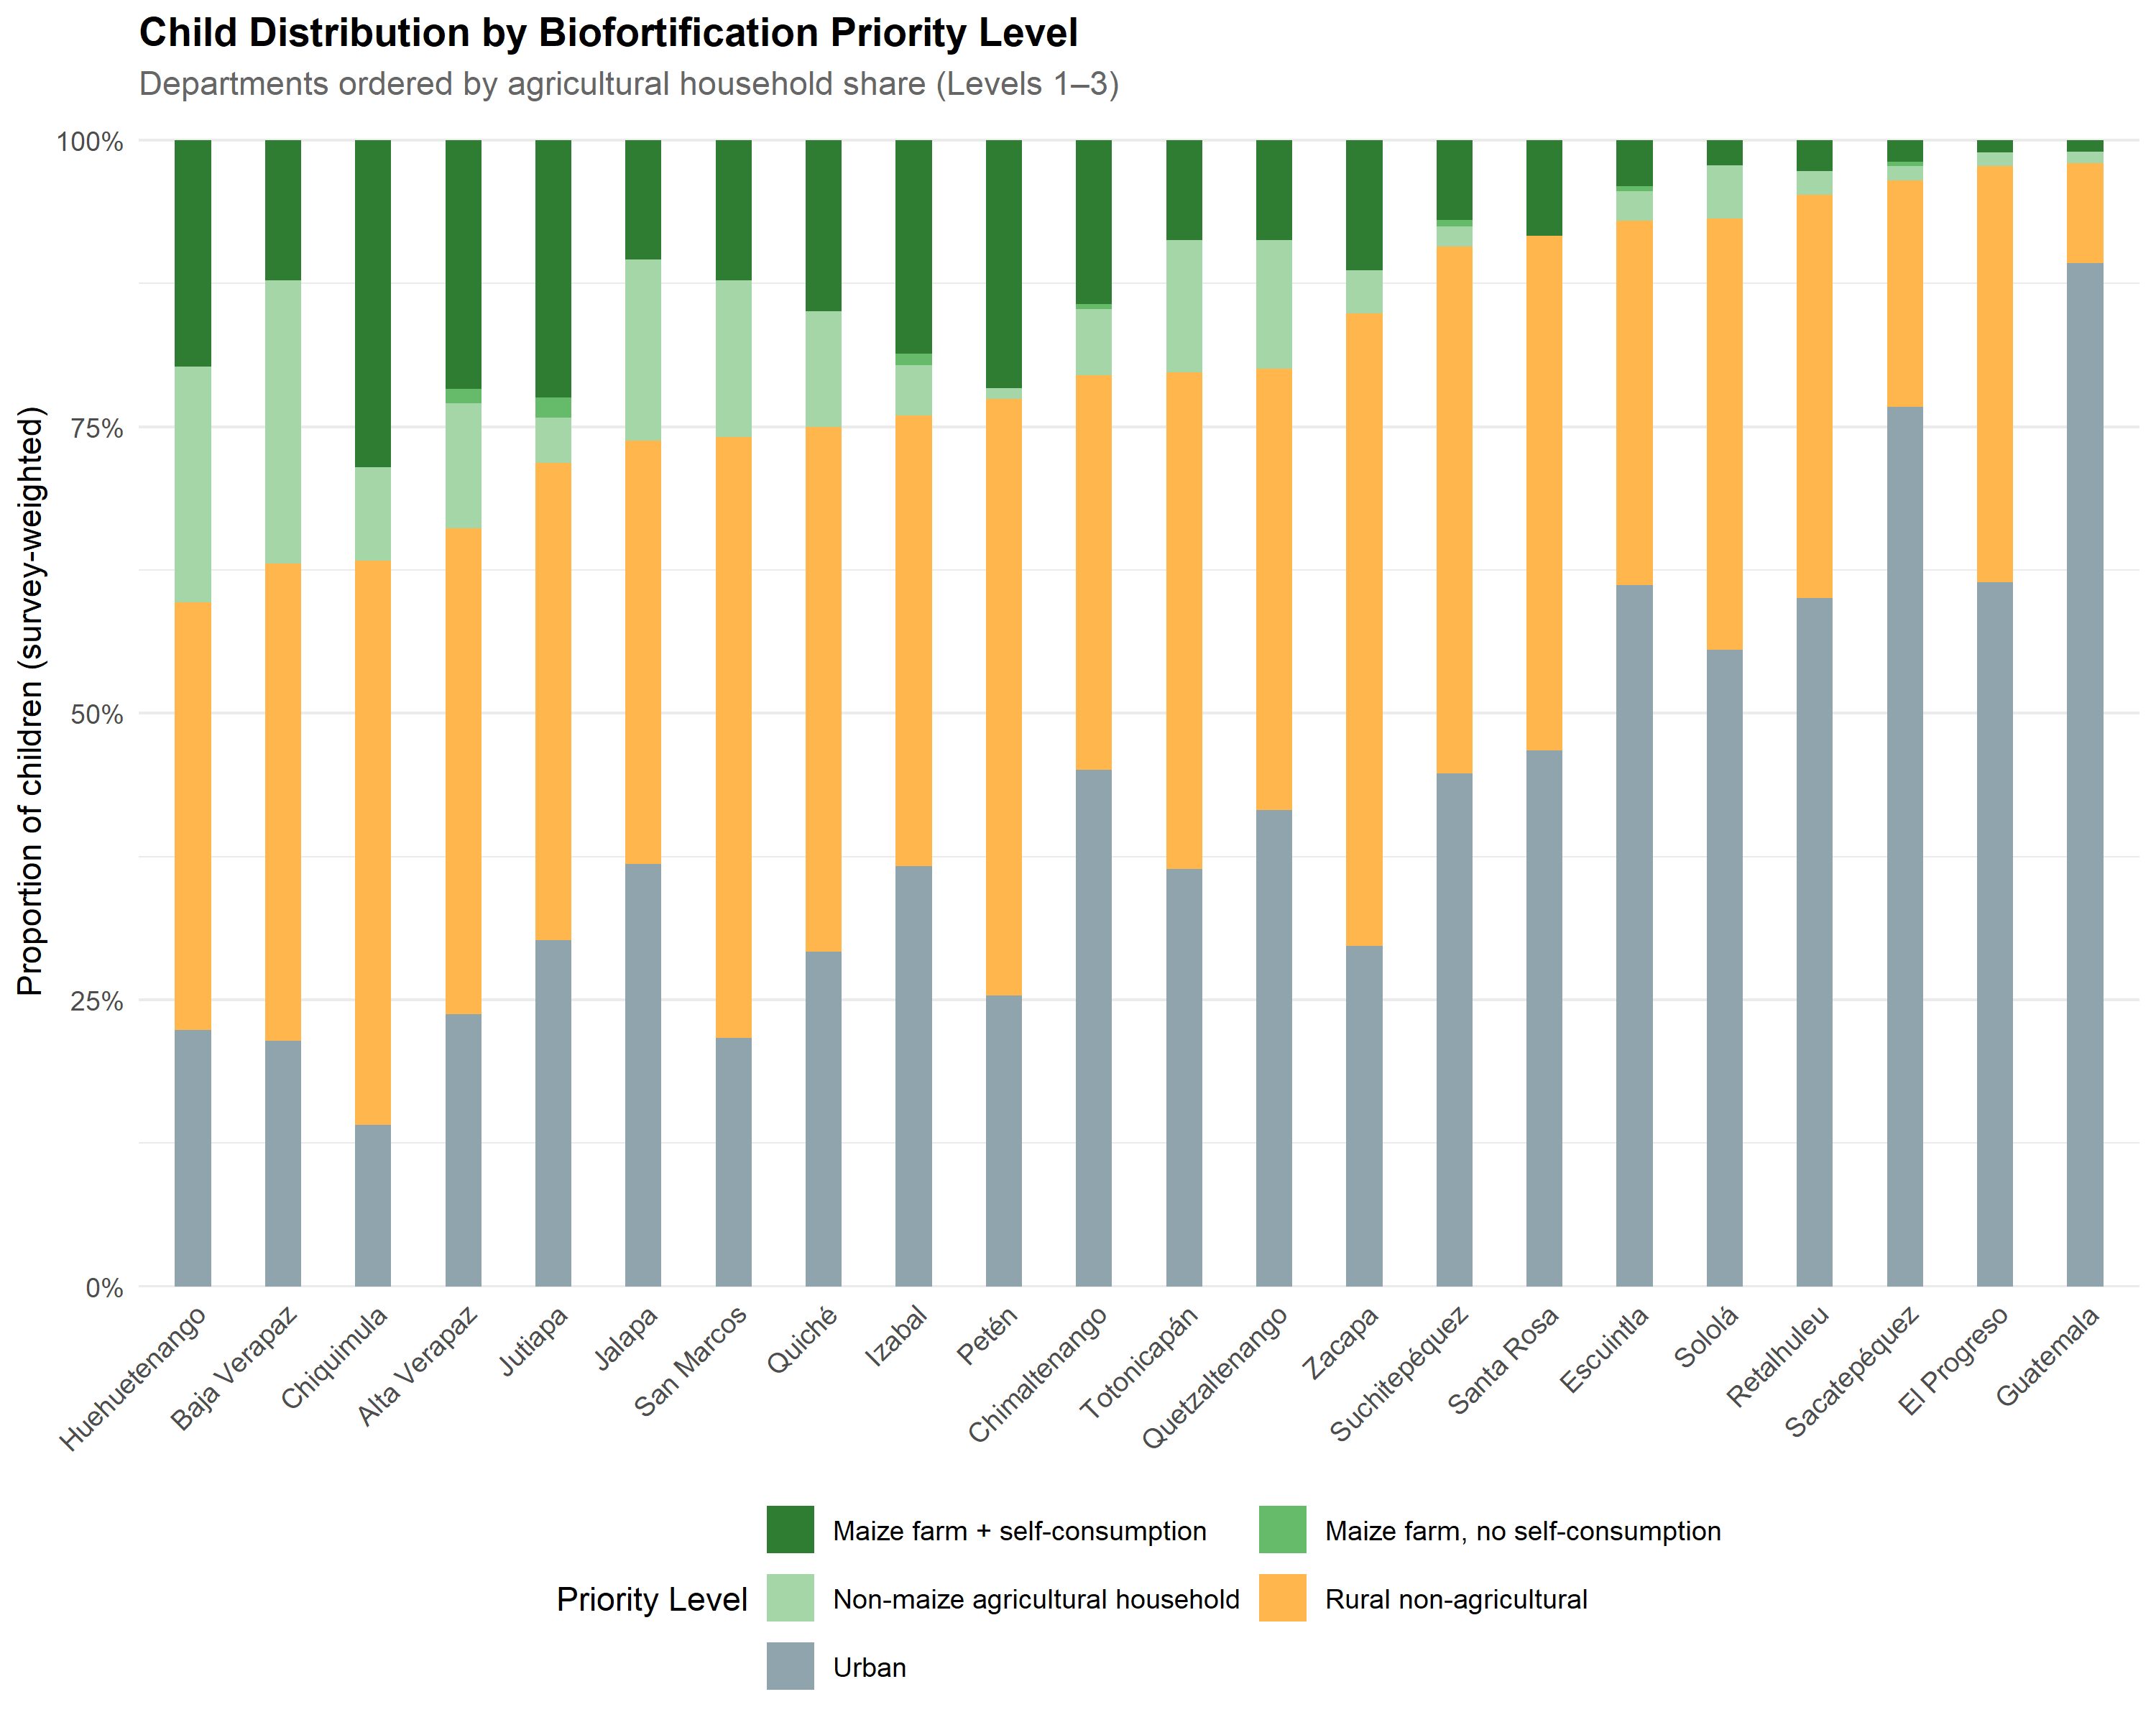
The agricultural household share varies widely across departments (see Figure 1). It reaches 39.7% in Huehuetenango and 37.0% in Chiquimula at one end, and falls to 2.0% in Guatemala and 2.2% in El Progreso at the other, where Level 5 covers 89.3% and 62.0% of children respectively.
Stunting by Priority Level
| Baseline Stunting Prevalence by Priority Level | |||||
| Survey-weighted proportion of children with HAZ < -2 SD | |||||
| Level | Description | Stunting % | 95% CI Lower | 95% CI Upper | Population |
|---|---|---|---|---|---|
| 1 | Maize farm + self-consumption | 65.3% | 58.9% | 71.7% | 188,724 |
| 2 | Maize farm, no self-consumption | 36.1% | 4.1% | 68.1% | 3,905 |
| 3 | Non-maize agricultural household | 62.0% | 53.5% | 70.5% | 130,945 |
| 4 | Rural non-agricultural | 66.4% | 62.8% | 70.0% | 578,911 |
| 5 | Urban | 24.1% | 20.2% | 28.0% | 620,077 |
NoteStunting by Level
The separation runs between rural and urban rather than along the five levels in order (see Table 7). Levels 1, 3 and 4 sit together at 65.3%, 62.0% and 66.6%, and Level 5 stands apart at 24.1%. The highest prevalence is Level 4, rural non-agricultural households, not Level 1.
Level 2 reads 36.2%, but it rests on 10 sampled children and its confidence interval runs from 4.1% to 68.2%, so the point estimate carries little information. The hierarchy orders access to biofortified maize; it is not ordered by stunting prevalence.
Output Dataset Structure
The output dataset carries the variables of the QPM stunting impact dataset and adds two: priority_level, an integer from 1 to 5, and priority_label, a factor with the descriptive labels. The existing columns pass through unchanged.
| Output Dataset Structure | |
| Priority assignment added to the QPM stunting impact dataset | |
| Metric | Value |
|---|---|
| Total rows | 4,065 |
| Total columns | 138 |
| Original columns (05_05) | 136 |
| New columns added | 2 |
| Original columns modified | 0 |
Summary
Key Findings
Complete assignment: Each of the 4,065 children receives a priority classification, with no missing values in
priority_level,areaorno_hogar(see Table 3 and Table 4).Agricultural household share: 21.3% of the child population (Levels 1-3) lives in households with direct or indirect agricultural connections to the biofortification supply chain (see Table 5).
Maize self-consumption dominance: 96.6% of maize-producing households retain part of their production for own consumption (Level 1 against Level 2 in Table 1), which places most of the direct channel inside the household itself.
Stunting by level: Levels 1, 3 and 4 carry baseline stunting between 62.0% and 66.6% and Level 5 carries 24.1% (see Table 7), so the contrast that shows up is rural against urban rather than a gradient along the hierarchy.
WarningLimitations
Self-consumption as proxy — The flag indicates retention of maize production but does not quantify the amount consumed. A household retaining a small fraction receives the same Level 1 priority as one consuming most of its harvest.
Agricultural module coverage — ENCOVI may undercount subsistence farming, particularly among indigenous communities. Some Level 4-5 households may have unregistered agricultural activity.
Static classification — The hierarchy is built on ENCOVI 2023 cross-sectional data, so seasonal variation in agricultural employment falls outside it.
Level 2 sample size — Level 2 rests on 10 sampled children, and its stunting estimate carries a confidence interval from 4.1% to 68.2%.
Application
This priority-enriched dataset is the final input for the scenario simulation pipeline (Module 6), which uses the priority hierarchy to assign biofortified maize to children in order of decreasing agricultural proximity at each production coverage level.