| Outlier Detection: Implausible Intake Records | |||||
| Maize ceiling 2,500 kcal/day, plus the non-maize Tukey screen at Q3 + 3 x IQR | |||||
| Department | N Total | N Outliers | % Outliers | Mean kcal (outliers) | Mean kcal (valid) |
|---|---|---|---|---|---|
| Baja Verapaz | 203 | 52 | 25.6 | 12,938 | 791 |
| Quiché | 274 | 51 | 18.6 | 6,217 | 745 |
| Jalapa | 196 | 44 | 22.4 | 4,302 | 630 |
| San Marcos | 204 | 38 | 18.6 | 4,008 | 619 |
| Alta Verapaz | 247 | 38 | 15.4 | 4,255 | 621 |
| Petén | 200 | 35 | 17.5 | 4,319 | 659 |
| Izabal | 191 | 33 | 17.3 | 5,527 | 568 |
| Chiquimula | 136 | 31 | 22.8 | 10,240 | 639 |
| Totonicapán | 194 | 30 | 15.5 | 4,148 | 779 |
| Huehuetenango | 207 | 28 | 13.5 | 4,509 | 773 |
| Suchitepéquez | 223 | 24 | 10.8 | 3,782 | 590 |
| Quetzaltenango | 174 | 22 | 12.6 | 3,004 | 518 |
| Escuintla | 208 | 18 | 8.7 | 5,237 | 411 |
| Retalhuleu | 138 | 17 | 12.3 | 2,407 | 593 |
| Jutiapa | 173 | 17 | 9.8 | 3,363 | 459 |
| Santa Rosa | 117 | 16 | 13.7 | 3,700 | 589 |
| Chimaltenango | 204 | 15 | 7.4 | 5,533 | 548 |
| Guatemala | 173 | 12 | 6.9 | 3,854 | 293 |
| El Progreso | 138 | 11 | 8.0 | 4,092 | 409 |
| Zacapa | 151 | 11 | 7.3 | 3,109 | 475 |
| Sololá | 146 | 10 | 6.8 | 6,019 | 541 |
| Sacatepéquez | 168 | 5 | 3.0 | 1,429 | 323 |
| NATIONAL | 4,065 | 558 | 13.7 | 5,176 | 578 |
| Conversion: 3.65 kcal/g (INCAP, nixtamalized maize tortilla). | |||||
Pre-computing Baseline and QPM Profiles
Module 4: Covariate Prediction
Overview
This module pre-computes the complete baseline (conventional maize) and QPM (biofortified maize) nutritional and stunting profiles for every child in the synthetic population. Both nutrient indicators (intake, bioavailability, inadequacy) and stunting outcomes (nutritional index, GAM-derived HAZ change, stunting classification) are calculated upfront.
The result is a scenario-ready dataset where downstream scripts need only select between pre-computed *_baseline and *_qpm columns based on each child’s biofortification assignment flag. This pre-computation is possible because:
- The baseline index position depends only on the child’s observed non-maize intake, which is fixed.
- The QPM index position depends only on that intake, the child’s maize intake and the QPM biofortification factors, all fixed.
Therefore delta_zlen_qpm, the difference between the GAM fitted values at the two positions, is a fixed per-child parameter that can be calculated once and reused across every scenario in Module 6. The marginal effect at the baseline position is computed alongside it and reported as a diagnostic, but does not enter the impact calculation.
Main operations:
- Load the synthetic population from Generating Synthetic Population.
- Load the GAM model and z-score normalization parameters from Continuous Stunting Model.
- Detect implausible consumption records, against a maize energy ceiling and a Tukey screen on each non-maize component, and impute the affected nutritional variables using k-Nearest Neighbours. Screen non-maize digestible protein separately and impute the records it flags.
- Define QPM biofortification factors, absorption parameters, and H-AR thresholds for inadequacy classification.
- Calculate the baseline nutritional profile: total intake, bioavailability, inadequacy classification, and nutritional index.
- Calculate the QPM nutritional profile: biofortified intake, bioavailability, inadequacy classification, and nutritional index.
- Express both nutritional indices on the estimation scale of the GAM, then calculate the delta NI and evaluate the smooth at both index positions.
- Derive QPM stunting outcomes: delta HAZ, updated HAZ, and stunting classification.
- Generate diagnostic tables comparing baseline and QPM profiles.
- Export the enriched dataset with both profiles for scenario simulation.
Data Sources
Synthetic Population
The input dataset is the calibrated synthetic population from Generating Synthetic Population. It contains synthetic children with maize and non-maize nutrient intake components, survey weights, baseline stunting predictions (zlen_predicted, hfa_calculated), and all covariates needed for scenario simulation.
GAM Model and Normalization Parameters
The trained GAM for the nutritional-index → HAZ relationship and the z-score normalization parameters come from Continuous Stunting Model. Two parameter sets are loaded: those of the calibrated whole-diet index, and those of the non-maize axis the GAM is fitted on. Both the baseline position and the QPM increment are built on the non-maize axis with its own parameters, so the increment is read off a curve whose unit means the same thing on both sides. All are fixed objects and remain constant across scenarios.
QPM Biofortification Factors
Nutrient content increases in Quality Protein Maize (QPM) biofortified varieties relative to conventional maize, following the reference values reported for the deployed varieties (Semilla Nueva, 2020). Biofortification is achieved through traditional plant breeding, not genetic modification.
PDCAAS calculation method. The Protein Digestibility Corrected Amino Acid Score (PDCAAS) follows FAO/WHO methodology (World Health Organization et al., 2007) for children aged 1–2 years, the most vulnerable segment of the target population:
\[PDCAAS = AAS \times Digestibility = \frac{Lys_{maize}}{Lys_{requirement}} \times D\]
| Parameter | Conventional | Biofortified | Source |
|---|---|---|---|
| Lysine (mg/g maize) | 20.0 | 39.6 | Semilla Nueva Standard Report (2020) |
| FAO requirement (1–2 yr) | 52 mg/g | 52 mg/g | FAO/WHO 2007, Table 36 |
| Amino Acid Score (AAS) | 0.385 | 0.762 | = Lys_maize / 52 |
| Digestibility | 0.824 | 0.809 | Boye et al. 2012 |
| PDCAAS | 0.317 | 0.616 | = AAS × Digestibility |
| Biofortification factor | — | 1.94 | = 0.616 / 0.317 |
Biofortification factors applied to the maize-source nutrient components:
| Nutrient | Factor | Source |
|---|---|---|
| Iron | 1.19 | Semilla Nueva Standard Report (2020), +19% |
| Zinc | 1.38 | Semilla Nueva Standard Report (2020), +38% |
| Protein | 1.94 | PDCAAS increase from 0.317 to 0.616 (+94% utilizable protein) |
| Lysine | 1.98 | Semilla Nueva Standard Report (2020), 2.00% → 3.96% of protein |
| Tryptophan | 1.425 | Semilla Nueva Standard Report (2020), 0.40% → 0.57% of protein |
| Energy | 1.00 | Unchanged in QPM varieties |
Total protein quantity is unchanged in QPM varieties; what changes is the amino acid profile. Lysine and tryptophan carry that change directly, and the PDCAAS rises from 0.317 to 0.616 as its consequence.
ImportantEach Series Receives the Change Once
The lysine and tryptophan factors apply to the amino acid series, which feed the nutritional index. The protein factor applies to the PDCAAS-adjusted protein series, which feeds the inadequacy classification against the protein H-AR threshold. The two series are separate, so applying a factor to each counts the same underlying change once on each side, and not twice on either.
Absorption Parameters
Iron absorption is set to a uniform 5% based on Allen et al. (2020) for predominantly plant-based, high-phytate diets — the dietary pattern of the target population (>80% plant foods).
Zinc absorption follows the Miller equation (Miller et al., 2015) with parameters \(K_T = 2.42\) (saturation constant), \(A = 0.633\) (age coefficient), and \(E = 0.311\) (age exponent). The equation computes total absorbed zinc (TAZ) as a non-linear function of dietary zinc and age:
\[TAZ = \frac{1}{2}\left(K_T + A \cdot Age^{E} + TDZ - \sqrt{(K_T + A \cdot Age^{E} + TDZ)^2 - 4 \cdot A \cdot Age^{E} \cdot TDZ}\right)\]
H-AR Thresholds for Inadequacy Classification
Harmonized Average Requirements (H-AR) define the thresholds below which a child’s absorbed nutrient intake is considered inadequate. Thresholds are expressed in absorbed (iron, zinc) or bioavailable (protein, PDCAAS-adjusted) units, matching the scale of the calculated nutrient values.
| Nutrient | Threshold | Age band | Source |
|---|---|---|---|
| Iron (absorbed) | 0.5 mg/day | All ages (6–59 months) | Allen et al. (2020) |
| Zinc (absorbed via Miller) | 0.732 mg/day | 6–11 months | EFSA (2014) |
| Zinc (absorbed via Miller) | 1.074 mg/day | 12–35 months | EFSA (2014) |
| Zinc (absorbed via Miller) | 1.390 mg/day | 36–59 months | EFSA (2014) |
| Protein (digestible, PDCAAS) | 13 g/day | 6–35 months | WHO/FAO safe intake |
| Protein (digestible, PDCAAS) | 19 g/day | 36–59 months | WHO/FAO safe intake |
Outlier Detection and Imputation
Two screens flag a record as implausible.
Maize ceiling. Children with daily maize energy intake exceeding 2,500 kcal — equivalent to approximately 685 g/day of nixtamalized maize at 3.65 kcal/g (INCAP conversion factor) — are flagged. That level exceeds plausible consumption for children aged 6–59 months and points to a systematic error in the household food consumption module the nutrient variables derive from.
Non-maize screen. The upper tail of the non-maize distribution reaches values far above the median, placing a fraction of the population outside the support of the SIVESNU distributions the models were fitted on. Each non-maize component — iron, zinc, lysine, tryptophan and energy — is therefore screened against its own upper Tukey fence at \(Q3 + 3 \times IQR\). The multiplier is 3 rather than the usual 1.5 because the rule declares a record implausible and triggers imputation: on non-maize energy it places the cut at a level that, from non-maize sources alone, already exceeds the total energy requirement for this age range.
All twelve source-specific nutrient variables (six maize-source and six non-maize-source) originate from the same ENCOVI household consumption module, so an implausible value on either side signals unreliable data across the entire nutrient profile. For flagged records, all twelve variables are set to NA and imputed using k-Nearest Neighbours (RANN k-d tree, k = 10, inverse-distance weighting).
Predictors. The imputation is conditioned on the child’s own ENCOVI record: age, sex, department, area, household education and the plant-source share of the diet. The quantity being reconstructed is an ENCOVI dietary value, so it is rebuilt from variables observed for the same child in the same survey, which keeps the reconstruction inside one measurement frame.
Five of the six are collected outside the food consumption module. The plant-source share is a composition ratio derived from it, and is retained on that basis: the reporting error the screen targets scales the reported quantities of a household and leaves their relative composition intact, so the ratio carries dietary-pattern signal that survives the error invalidating the amounts.
The set carries one variable per dimension of the matching space — demographics, geography, socioeconomic position and diet composition. All are continuous or binary, which keeps the scaled Euclidean metric well defined and leaves each dimension weighted once.
Records are imputed, never dropped, so the synthetic population stays representative.
Imputed values are floored at zero to prevent negative nutrient intakes.
Outlier Detection Summary
k-NN Imputation Quality
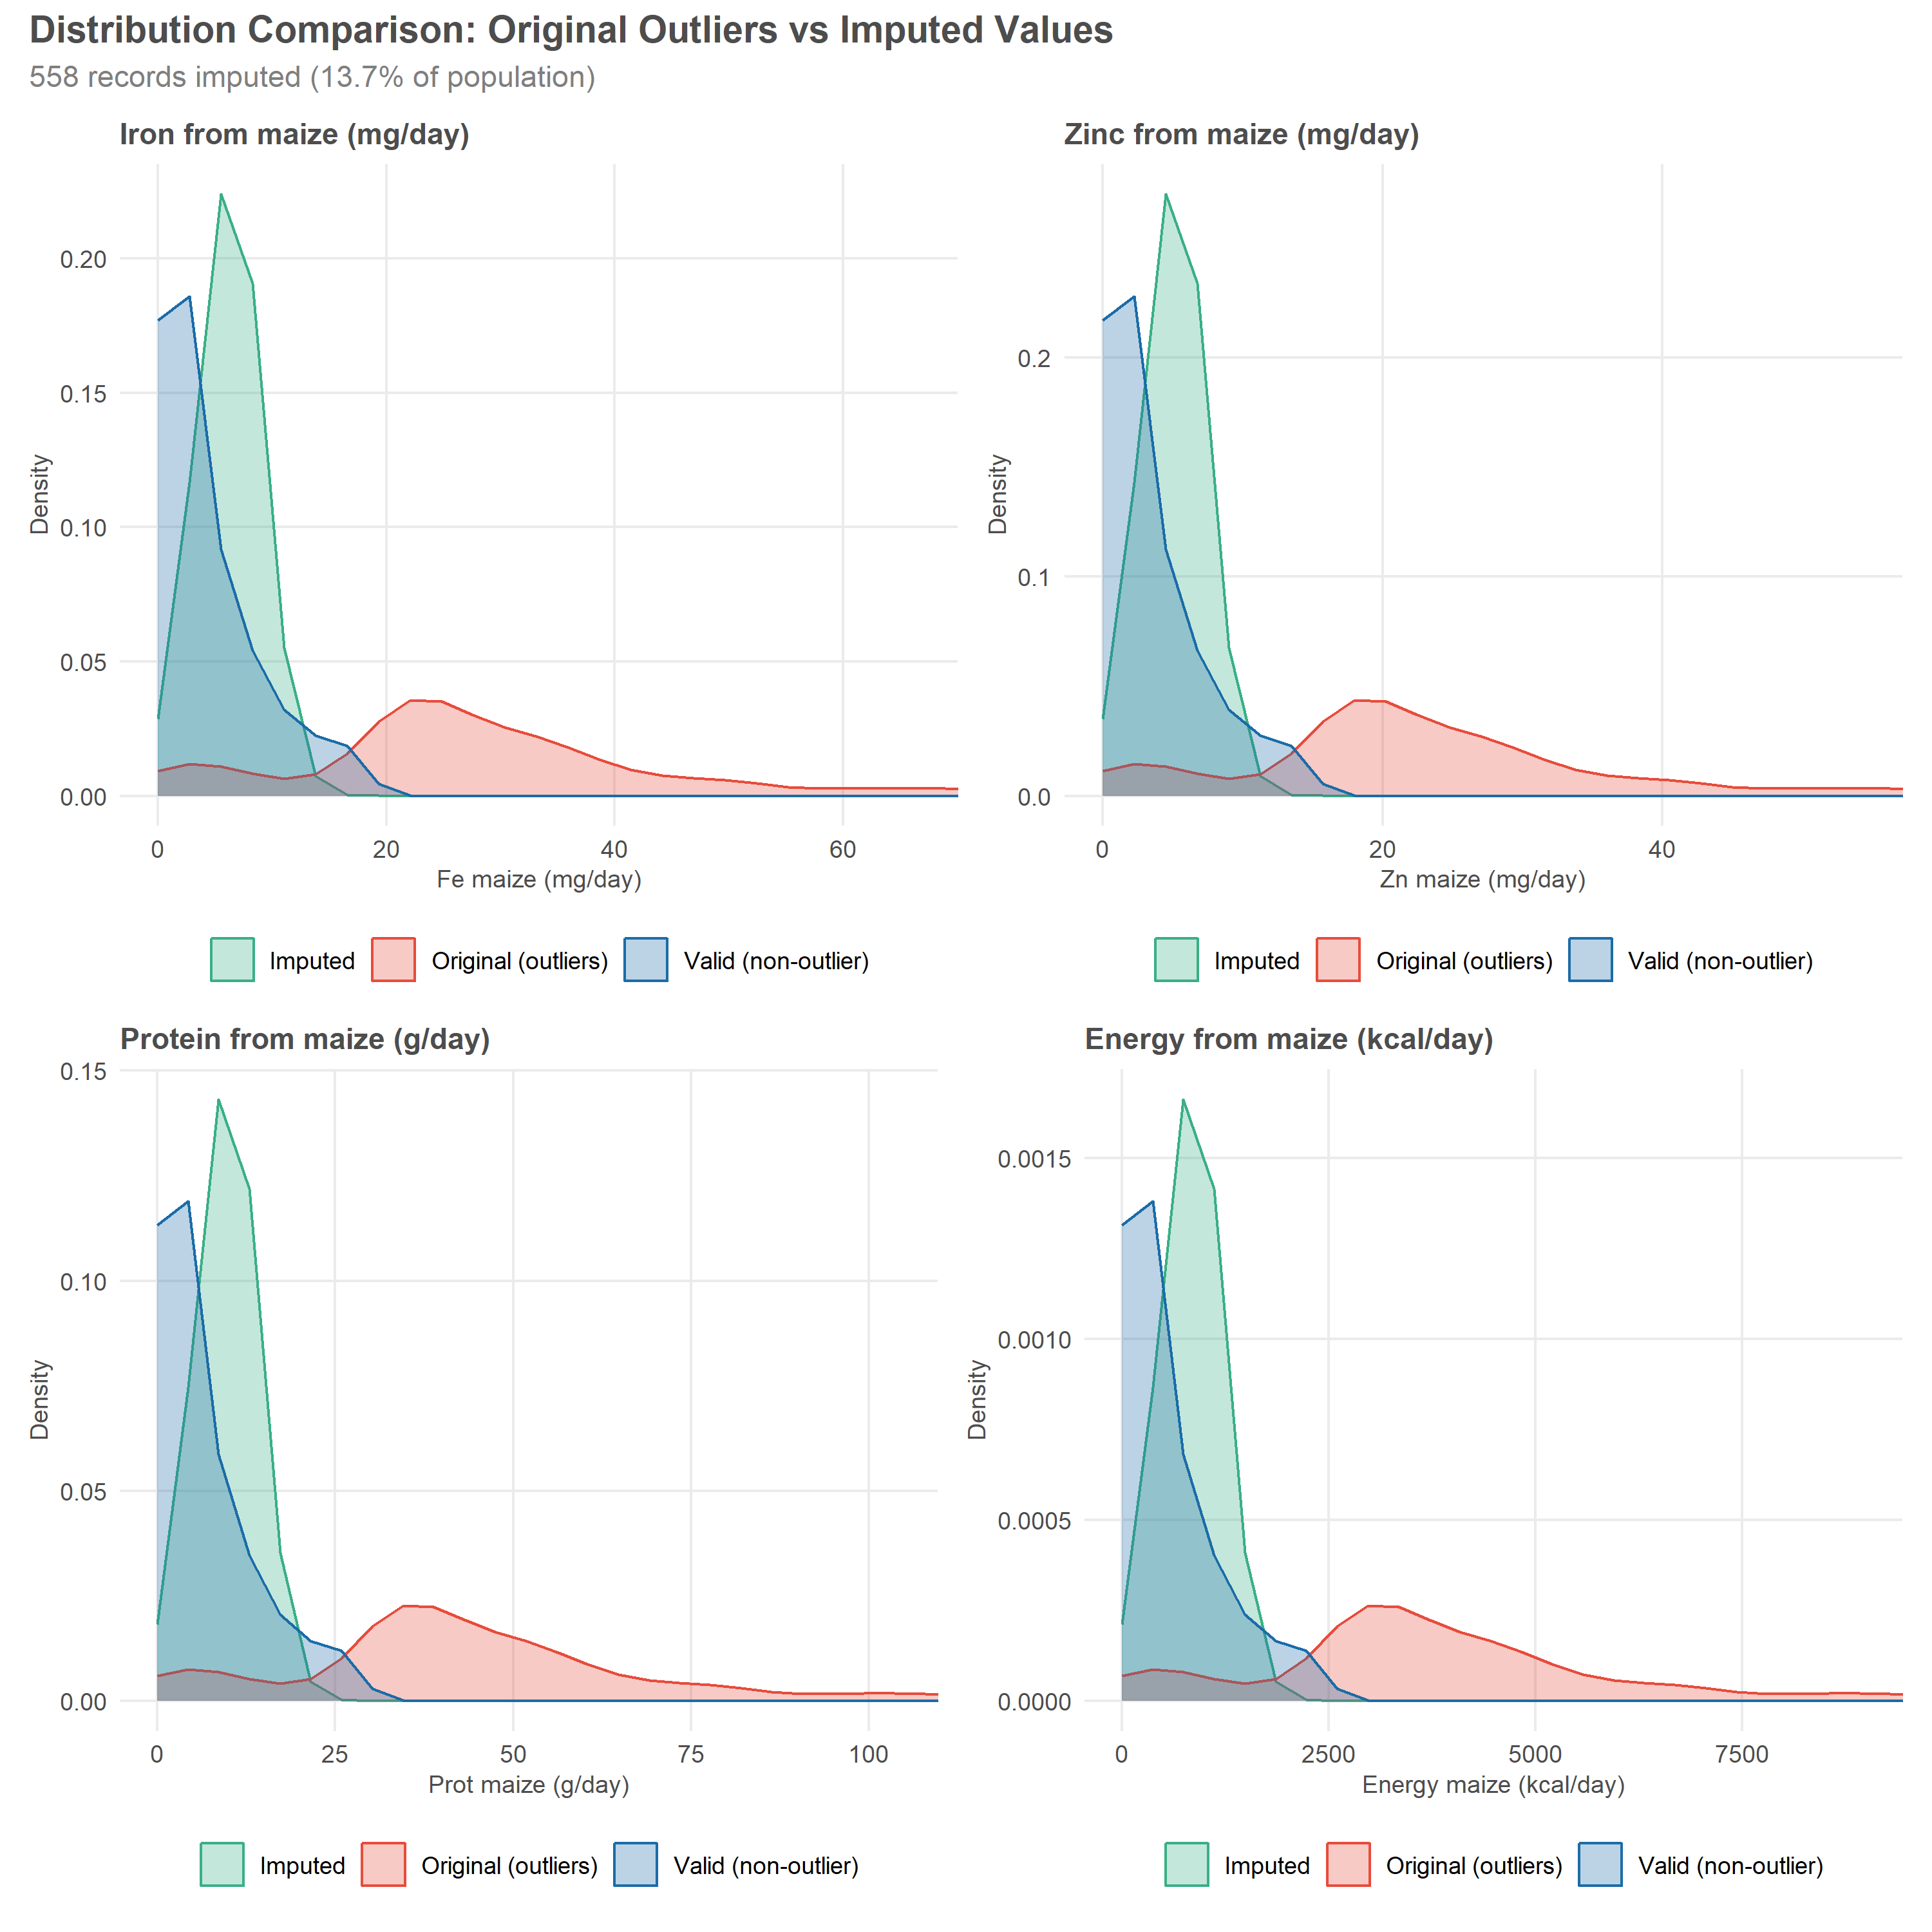
Imputation quality is evaluated by comparing the distribution of imputed values against valid records within the same departments where outliers concentrate. Since outlier records are disproportionately located in high-maize-consumption departments (Alta Verapaz, Baja Verapaz, Totonicapán), a national-level comparison would underestimate the expected intake for these children. The department-stratified comparison provides a more appropriate benchmark.
Mean ratios close to 1.0 indicate that imputed values are consistent with the intake patterns observed among valid children in the same geographic and demographic context.
| k-NN Imputation Quality Assessment | ||||||
| k = 10, inverse-distance weighted, RANN k-d tree | ||||||
| Variable | Valid Mean | Valid SD | Imputed Mean | Imputed SD | Mean Ratio | SD Ratio |
|---|---|---|---|---|---|---|
| fe_mg_maiz | 4.30 | 4.38 | 6.18 | 2.53 | 1.438 | 0.578 |
| fe_mg_nomaiz | 5.86 | 3.15 | 5.40 | 1.42 | 0.922 | 0.450 |
| zn_mg_maiz | 3.50 | 3.57 | 5.04 | 2.06 | 1.438 | 0.578 |
| zn_mg_nomaiz | 2.61 | 1.60 | 2.20 | 0.75 | 0.844 | 0.467 |
| prot_g_maiz | 6.72 | 6.85 | 9.66 | 3.96 | 1.438 | 0.578 |
| prot_g_nomaiz | 9.46 | 7.48 | 7.12 | 3.89 | 0.753 | 0.520 |
| lys_mg_maiz | 0.43 | 0.44 | 0.62 | 0.25 | 1.438 | 0.578 |
| lys_mg_nomaiz | 0.78 | 0.62 | 0.60 | 0.31 | 0.770 | 0.501 |
| trp_mg_maiz | 0.11 | 0.11 | 0.16 | 0.07 | 1.438 | 0.578 |
| trp_mg_nomaiz | 0.13 | 0.10 | 0.11 | 0.05 | 0.809 | 0.496 |
| ene_kcal_maiz | 578.51 | 589.52 | 832.15 | 341.01 | 1.438 | 0.578 |
| ene_kcal_nomaiz | 437.02 | 297.55 | 380.91 | 145.26 | 0.872 | 0.488 |
| Comparison stratified to departments containing outlier records. | ||||||
Pre- and Post-Imputation Density Comparison
Density plots comparing the distribution of key nutritional variables before and after imputation. The imputed values (outlier records only) fall within the range of valid observations, concentrated around the conditional mean that k-NN imputation produces.
Non-Maize Protein Outlier Treatment
Digestible protein from non-maize sources carries a heavy right tail in the dietary intake distribution. A small fraction of children report non-maize protein intake above its upper Tukey fence, and those values propagate into the protein totals.
Protein is screened on its own axis, once the block treatment above has settled the rest of the nutrient profile. The criterion targets the tail of a single component rather than a systematically unreliable record, so the fence multiplier is 1.5 rather than the 3 used for the block screen. Records above the fence are replaced by k-NN imputation with the same predictor set and the same weighting; only the non-maize protein variable is invalidated and imputed, and every other nutrient variable is carried through unchanged.
| Non-Maize Protein: Imputation Diagnostics | ||||
| 179 records imputed (4.4% of the synthetic population) | ||||
| Source | N | Mean | Median | Max |
|---|---|---|---|---|
| Valid (non-flagged) | 3,886 | 8.15 | 6.94 | 24.33 |
| Original outliers | 179 | 30.53 | 29.29 | 45.08 |
| Imputed (k-NN) | 179 | 12.28 | 12.24 | 18.73 |
| Tukey upper fence at Q3 + 1.5 x IQR. k-NN RANN (k = 10, inverse-distance weighted), same predictors as the block imputation. | ||||
NoteWhere the Protein Replacements Land
The flagged records averaged 30.5 g/day of non-maize digestible protein against 8.2 g/day among the valid records. Their replacements average 12.3 g/day, so they sit within the range the valid records occupy rather than at its centre.
Baseline Nutritional Profile
The baseline profile represents each child’s nutritional status under conventional maize consumption. For every child, the following are computed:
Total intake: maize + non-maize components for iron, zinc, protein, lysine, tryptophan, and energy.
Iron bioavailability: uniform 5% absorption applied to total iron intake.
Zinc bioavailability: total absorbed zinc (TAZ) via the Miller equation, age-dependent.
Nutritional index: four-component biofortification-responsive index on the non-maize axis, built from z-score-normalized absorbed iron, TAZ, lysine and tryptophan, using the fixed normalization parameters of that axis:
\[NI_{bio}^{nomaiz} = \frac{1}{4}\left(Fe_{absorbed,z} + Zn_{absorbed,z} + Lys_{z} + Trp_{z}\right)\]
Inadequacy classification: comparison of absorbed iron, TAZ, and PDCAAS-adjusted protein against the age-specific H-AR thresholds defined above.
The result is a per-child baseline vector of intake totals, absorbed fractions, inadequacy flags, and the nutritional index used by the downstream GAM impact calculation.
QPM Nutritional Profile
The QPM profile is computed analogously to the baseline, but applies the biofortification factors to the maize-source components before summing:
\[Nutrient_{total,QPM} = Nutrient_{maize} \times Factor_{QPM} + Nutrient_{non\text{-}maize}\]
Non-maize sources remain unchanged, since biofortification modifies only the maize component of the diet. The same Miller equation, z-score parameters, and H-AR thresholds are reused so that baseline and QPM are strictly comparable. The output is a parallel per-child vector of QPM intake totals, absorbed fractions, inadequacy flags, and nutritional_index_bio_qpm.
GAM-Based Stunting Impact
The stunting impact of full biofortification is obtained by evaluating the GAM at each child’s baseline and biofortified position on the index.
Delta NI captures the change in the four-component non-maize nutritional index attributable to full biofortification:
\[\Delta NI = NI_{bio,QPM}^{nomaiz} - NI_{bio,baseline}^{nomaiz}\]
This value is fixed per child and invariant across production coverage levels — it is the whole distance the index travels under complete adoption.
Delta HAZ is the difference between the two fitted values, with age and sex held at each child’s observed values:
\[\Delta HAZ_{QPM} = f\left(NI_{bio,QPM}^{nomaiz}\right) - f\left(NI_{bio,baseline}^{nomaiz}\right)\]
Taking the difference of fitted values, rather than a first-order term, lets the estimate follow the curvature of the smooth across the whole interval the index traverses. The marginal effect at the baseline position is also computed and retained as a diagnostic.
Index Distribution Under Both Profiles
The table below reports where the index sits before and after full biofortification, on both axes. The non-maize axis is the one the GAM is evaluated on; the whole-diet axis is reported alongside it as the descriptive counterpart on the scale the rest of the pipeline uses.
| Nutritional Index Profiles | ||||||
| Survey-weighted quantiles across the synthetic population | ||||||
| Quantile |
Whole-diet axis (descriptive)
|
Non-maize axis (evaluated by the GAM)
|
||||
|---|---|---|---|---|---|---|
| Baseline | QPM | Delta | Baseline | QPM | Delta | |
| P1 | −1.211 | −1.198 | 0.000 | −1.452 | −1.337 | 0.000 |
| P5 | −0.995 | −0.963 | 0.005 | −1.263 | −1.029 | 0.010 |
| P25 | −0.534 | −0.439 | 0.073 | −0.764 | −0.312 | 0.158 |
| P50 | −0.072 | 0.108 | 0.172 | −0.295 | 0.398 | 0.428 |
| P75 | 0.365 | 0.658 | 0.306 | 0.371 | 1.095 | 0.876 |
| P95 | 1.060 | 1.582 | 0.559 | 1.765 | 2.390 | 1.671 |
| P99 | 1.483 | 2.031 | 0.675 | 2.718 | 3.320 | 2.116 |
Updated HAZ under QPM and the corresponding stunting classification:
\[HAZ_{QPM} = HAZ_{baseline} + \Delta HAZ_{QPM}\] \[\text{Stunted}_{QPM} = \mathbb{1}\{HAZ_{QPM} < -2\}\]
A child whose stunting status flips from stunted at baseline to not stunted under QPM is flagged as stunting_resolved_qpm = 1.
Pre-Computed Stunting Impact Summary
| Stunting Impact: Baseline vs QPM (Full Biofortification) | |||
| Survey-weighted estimates for all synthetic children | |||
| Metric | Baseline | QPM | Change |
|---|---|---|---|
| Mean ZLEN | −2.03 | −1.86 | 0.16 |
| Stunting prevalence (%) | 48.58 | 43.04 | −5.54 |
| Mean delta ZLEN (QPM effect) | — | 0.16 | — |
| Cases with stunting resolved | — | 84,336 | — |
| Stunting resolved (%) | — | 5.54 | — |
| GAM: s(nutritional_index_bio) → HAZ. Floor constraint: delta HAZ ≥ 0. | |||
Stunting Impact by Age Band
The table below disaggregates delta NI, marginal effect, and delta HAZ by 6-month age bands. Two elements of the construction vary with age: the age-dependent AME granularity underlying the baseline nutrient intake estimates, and the position of each age group on the GAM smooth.
| Delta NI and Stunting Impact by 6-Month Age Band | ||||||
| Survey-weighted estimates (full biofortification) | ||||||
| Age (months) | N | Mean Δ NI | Mean Marginal Effect | Mean Δ HAZ | Stunting Baseline (%) | Reduction (pp) |
|---|---|---|---|---|---|---|
| 6-11 | 421 | 0.4251 | 0.2845 | 0.1209 | 37.39 | 3.39 |
| 12-17 | 409 | 0.4678 | 0.2845 | 0.1331 | 39.96 | 3.41 |
| 18-23 | 435 | 0.5013 | 0.2845 | 0.1426 | 49.78 | 4.54 |
| 24-29 | 431 | 0.5887 | 0.2845 | 0.1675 | 53.45 | 6.79 |
| 30-35 | 471 | 0.6321 | 0.2845 | 0.1798 | 51.82 | 4.24 |
| 36-41 | 422 | 0.5908 | 0.2845 | 0.1681 | 54.11 | 7.07 |
| 42-47 | 443 | 0.6105 | 0.2845 | 0.1737 | 53.10 | 6.79 |
| 48-53 | 502 | 0.6303 | 0.2845 | 0.1793 | 49.41 | 5.61 |
| 54-59 | 531 | 0.7013 | 0.2845 | 0.1995 | 48.59 | 7.57 |
| Larger delta NI in the youngest band reflects the AME granularity for children aged 6–11 months. | ||||||
Baseline vs QPM Diagnostic Comparison
The following tables and visualizations compare the population-level nutrient intake, bioavailability, inadequacy prevalence, and individual-level deltas between the baseline and QPM profiles under full biofortification (every child consuming QPM).
Mean Nutrient Intake
| Nutrient Intake Comparison: Baseline vs QPM | ||||
| Survey-weighted mean intake (full biofortification, all children) | ||||
| Nutrient | Baseline | QPM | Delta | % Change |
|---|---|---|---|---|
| Iron (mg/day) | 10.25 | 11.12 | 0.87 | 8.5 |
| Zinc (mg/day) | 6.22 | 7.64 | 1.41 | 22.7 |
| Protein (g/day) | 15.44 | 22.15 | 6.71 | 43.5 |
| Lysine (mg/day) | 1.21 | 1.66 | 0.45 | 36.7 |
| Tryptophan (mg/day) | 0.25 | 0.30 | 0.05 | 20.3 |
| Energy (kcal/day) | 1,038.93 | 1,038.93 | 0.00 | 0.0 |
| Biofortification factors: Fe ×1.19, Zn ×1.38, Protein ×1.94 (PDCAAS). Lys, Trp, Energy unchanged. | ||||
Bioavailability and Nutritional Index
| Absorbed Nutrients and Nutritional Index: Baseline vs QPM | ||||
| Survey-weighted mean values (full biofortification) | ||||
| Nutrient | Baseline | QPM | Delta | % Change |
|---|---|---|---|---|
| Iron absorbed (mg/day) | 0.513 | 0.556 | 0.043 | 8.5 |
| Zinc absorbed — TAZ (mg/day) | 1.121 | 1.190 | 0.069 | 6.2 |
| Nutritional Index (4-component) | −0.051 | 0.155 | 0.207 | −403.8 |
| Iron: 5% absorption. Zinc: Miller equation. NI: z-score normalized (SIVESNU training params). | ||||
Inadequacy Prevalence
The table below compares the prevalence of inadequate intake (absorbed nutrient below the age-specific H-AR threshold) under baseline and QPM, and reports the share of inadequate children whose status is resolved by QPM.
| Inadequacy Prevalence: Baseline vs QPM | ||||
| Survey-weighted prevalence (%, full biofortification scenario) | ||||
| Nutrient | Baseline (%) | QPM (%) | Resolved (%) | Reduction (pp) |
|---|---|---|---|---|
| Iron | 53.8 | 49.3 | 4.4 | 4.4 |
| Zinc | 52.8 | 44.5 | 8.3 | 8.3 |
| Protein | 56.3 | 37.1 | 19.1 | 19.1 |
| Any nutrient | 66.6 | 53.7 | 12.9 | 12.9 |
| All three nutrients | 42.3 | 33.2 | — | 9.1 |
| H-AR: Fe 0.5 mg/d absorbed (Allen 2020), Zn age-dependent (EFSA 2014), Protein 13/19 g/d (WHO/FAO). | ||||
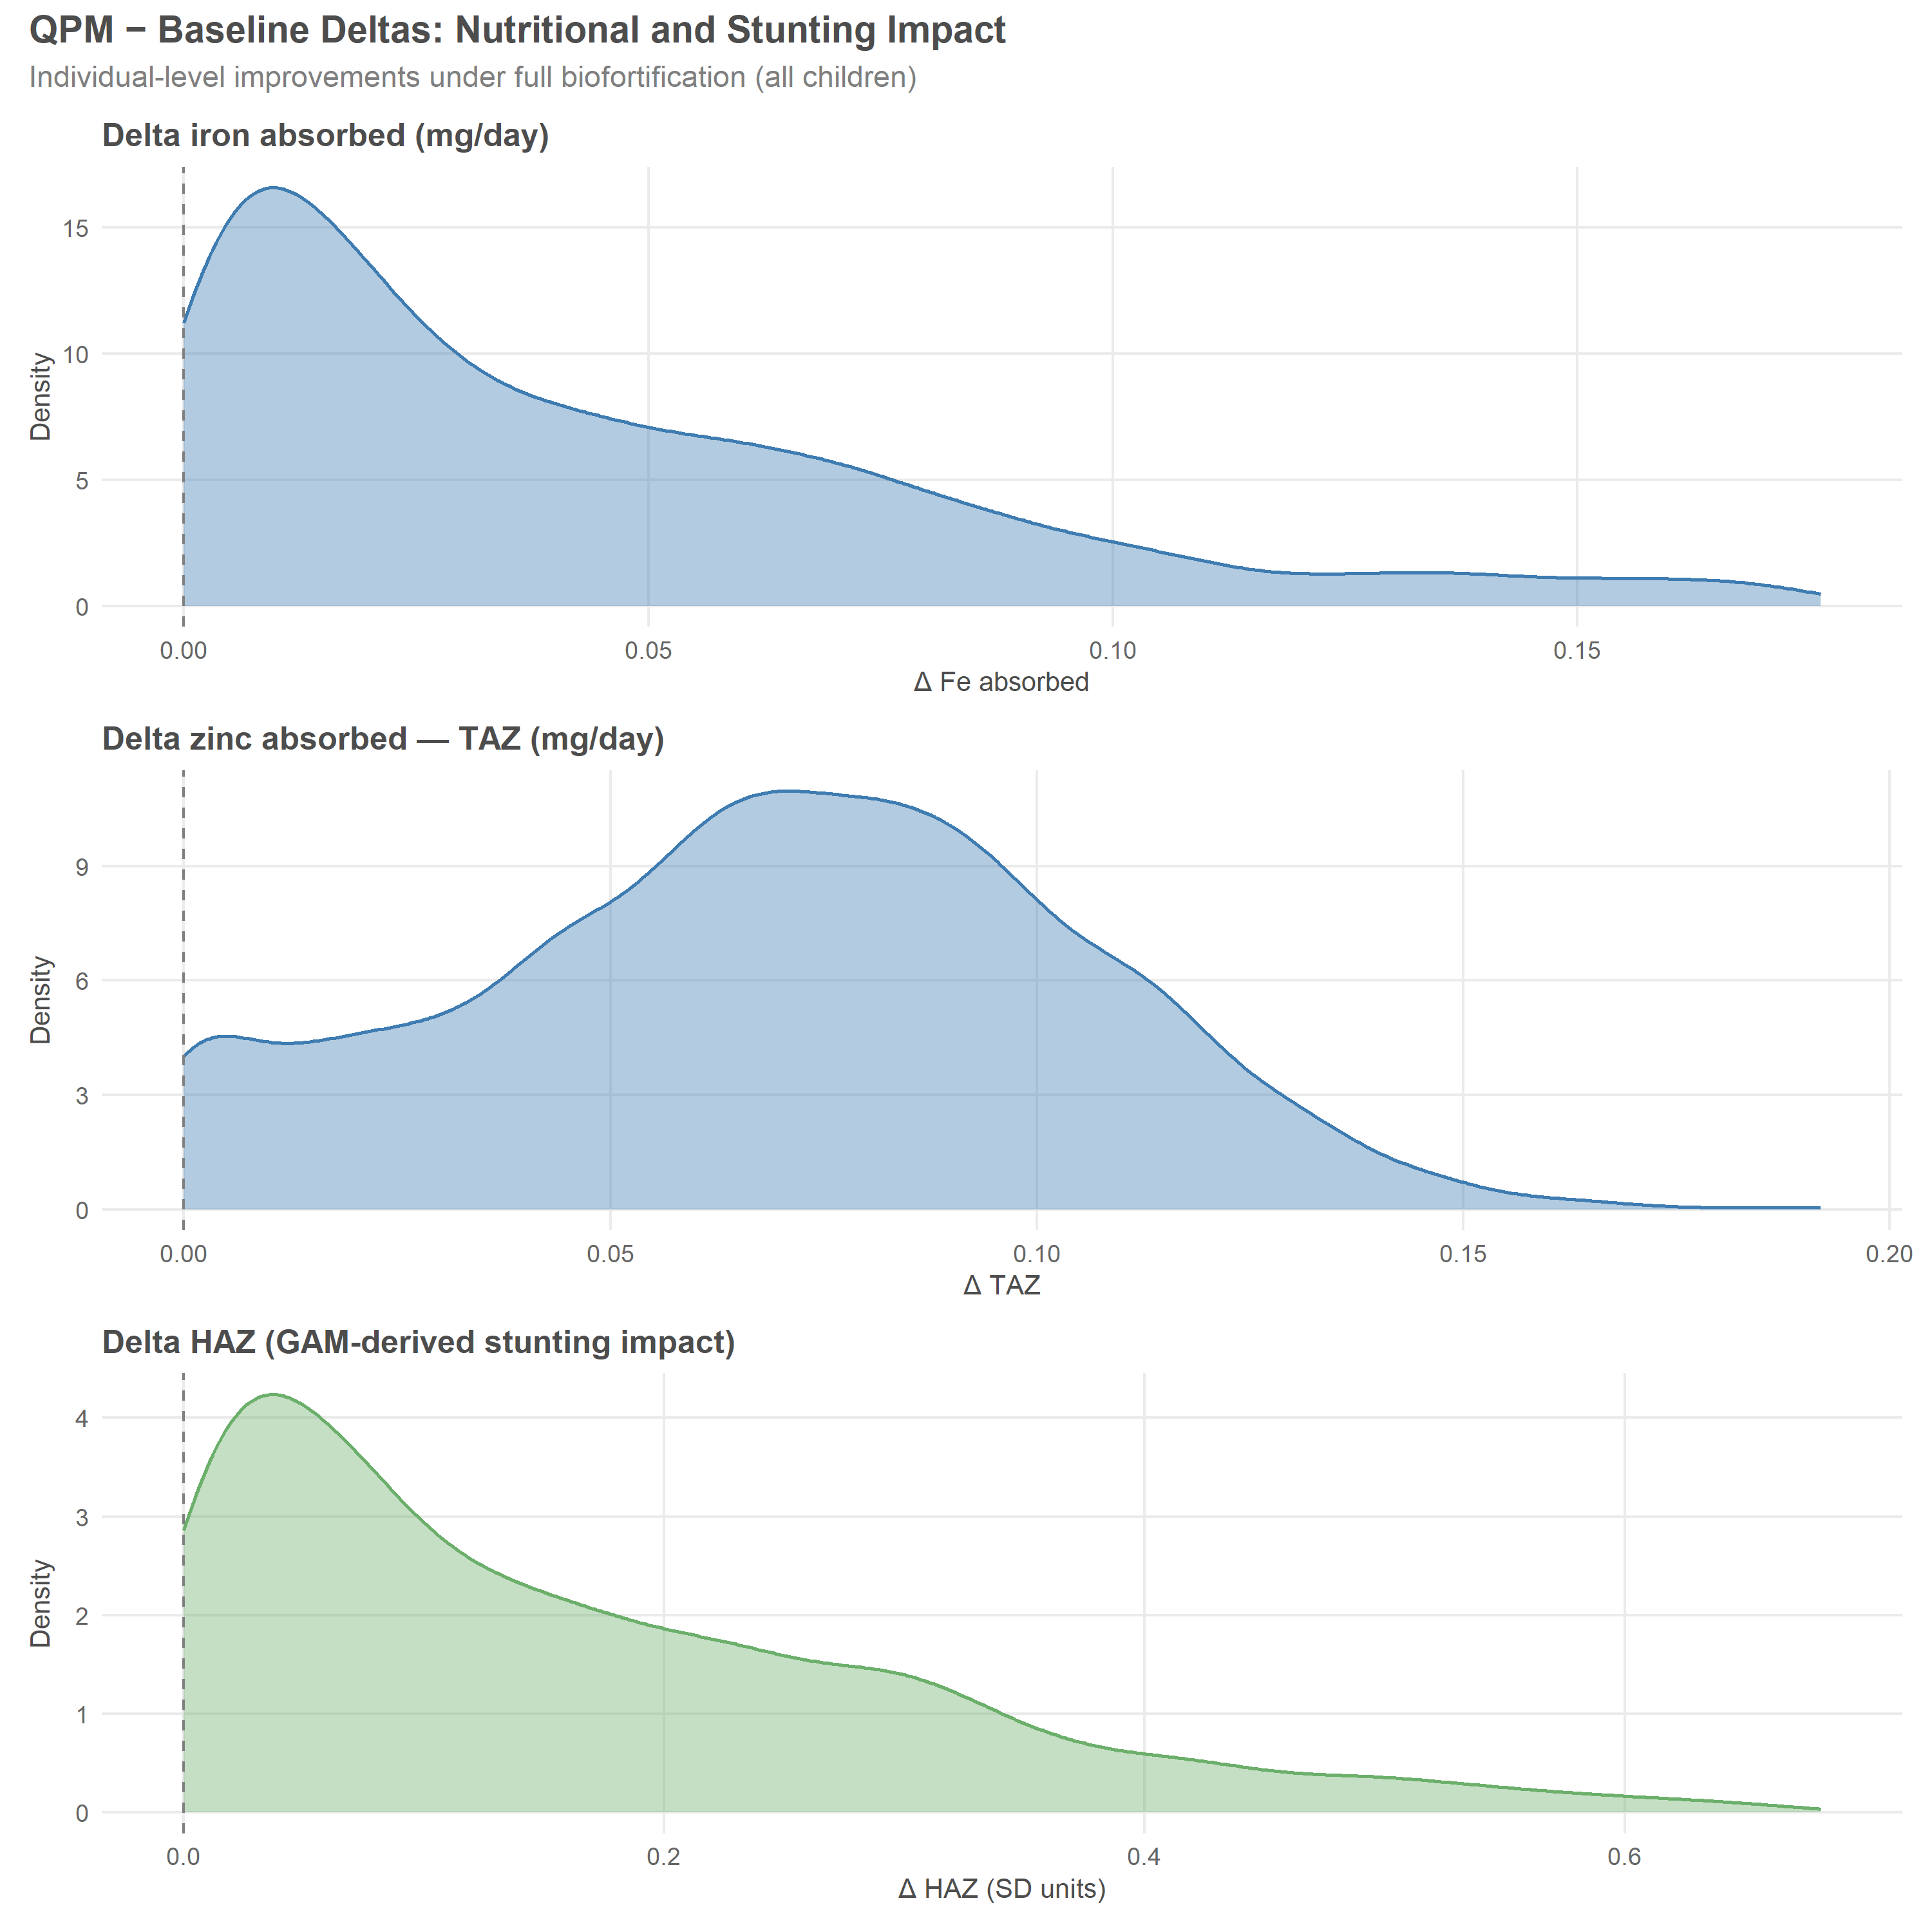
Delta Distributions
Density plots of the individual-level QPM − baseline deltas: absorbed iron, absorbed zinc (TAZ), and the GAM-derived stunting impact (delta HAZ). All distributions are bounded below at zero by construction.
Summary
Processing Pipeline
| Phase | Method | Purpose |
|---|---|---|
| A. Parameters | Fixed constants | QPM factors, absorption parameters, H-AR thresholds |
| B. Outlier treatment | Maize ceiling + non-maize Tukey screen + k-NN imputation, then a separate protein screen | Reconstruct the nutrient profile for implausible records |
| C. Baseline profile | Intake aggregation, Miller equation, z-score normalization | Per-child baseline vector under conventional maize |
| D. QPM profile | Biofortification factors applied to maize sources | Per-child QPM vector under biofortification |
| E. Stunting impact | Difference of GAM fitted values at the two index positions | Per-child delta HAZ and QPM stunting classification |
| F. Deltas | QPM − baseline | Individual-level improvements and resolution flags |
| G. Diagnostics | Population-level comparisons | Validate aggregate impact of full biofortification |
| H. Export | Split parquets | Scenario-ready dataset for Module 6 |
Key Results
- Outlier treatment: 558 records (13.7% of the synthetic population) imputed via k-NN, plus 179 records (4.4%) on the separate non-maize protein screen.
- Mean HAZ: -2.03 (baseline) → -1.86 (QPM under full biofortification).
- Stunting prevalence: 48.6% (baseline) → 43% (QPM); reduction of 5.6 percentage points under full biofortification.
- Mean delta HAZ: 0.164 SD units per child.
- Stunting resolved: 5.5% of all synthetic children flip from stunted at baseline to not stunted under QPM.
- Mean nutrient intake change: iron 8.5%, zinc 22.7%, PDCAAS-adjusted protein 43.5%.
- Inadequacy reduction: iron 4.4 pp, zinc 8.3 pp, protein 19.1 pp.
Application
The exported dataset is the input to the scenario simulation in Module 6. For every production coverage level, the scenario scripts select between the pre-computed *_baseline and *_qpm columns based on each child’s biofortification assignment flag. Since both vectors are calculated upfront, the scenario simulation reduces to a per-child indexing operation with no additional GAM evaluation, model prediction, or bioavailability calculation needed at runtime.
WarningLimitations
Extrapolation beyond the fitted range — The QPM index position can fall above the range the smooth was estimated on, where the GAM extends its fit without observations to support it.
Biofortification factor assumption — The QPM factors (Fe ×1.19, Zn ×1.38, lysine ×1.98, tryptophan ×1.425, and protein ×1.94 via PDCAAS) are derived from the Semilla Nueva Standard Report (2020) and FAO/WHO methodology for children aged 1–2 years. Realized nutrient gains in deployment may vary with seed variety, soil conditions, cooking practice, and the age composition of the consuming population.
k-NN imputation scope — Imputed values reflect the central tendency of demographically similar valid children. Individual variation within the neighbourhood is compressed by the inverse-distance weighting, leading to slightly narrower SDs for imputed records than for valid records (visible in the imputation quality table).
Predictor set of the imputation — The six predictors span demographics, geography, socioeconomic position and diet composition, one variable per dimension. Determinants of dietary intake outside those four dimensions are not represented in the matching space, so the replacements reproduce the central tendency of that space rather than the full heterogeneity of intake.
Iron absorption uniformity — The 5% absorption factor is uniform across all children, following Allen et al. (2020) for plant-based diets. Heterogeneity in heme iron consumption and inhibitor exposure (phytates, polyphenols, tannins) is not captured at the individual level.
References
Allen, L. H., Carriquiry, A. L., & Murphy, S. P. (2020). Perspective: Proposed Harmonized Nutrient Reference Values for Populations. Advances in Nutrition, 11(3), 469–483. https://doi.org/10.1093/advances/nmz096
Miller, L. V., Hambidge, K. M., & Krebs, N. F. (2015). Zinc Absorption Is Not Related to Dietary Phytate Intake in Infants and Young Children Based on Modeling Combined Data from Multiple Studies. The Journal of Nutrition, 145(8), 1763–1769. https://doi.org/10.3945/jn.115.213074
Semilla Nueva. (2020). Semilla Nueva Standard Report July-December 2020. Semilla Nueva.
World Health Organization, Food and Agriculture Organization of the United Nations, & United Nations University. (2007). Protein and Amino Acid Requirements in Human Nutrition: Report of a Joint WHO/FAO/UNU Expert Consultation. World Health Organization.