| FIES Item Response Distribution | ||||||
| Food Insecurity Experience Scale (8 items) | ||||||
| Code | Question | Severity | Yes | No | NA | % Yes |
|---|---|---|---|---|---|---|
| C001 | Worried about not having enough food | Mild | 533 | 282 | 0 | 65.4 |
| C002 | Unable to eat healthy/nutritious food | Mild | 386 | 429 | 0 | 47.4 |
| C003 | Ate only a few kinds of foods | Mild | 399 | 416 | 0 | 49.0 |
| C004 | Had to skip a meal | Moderate | 168 | 647 | 0 | 20.6 |
| C005 | Ate less than should | Moderate | 272 | 543 | 0 | 33.4 |
| C006 | Household ran out of food | Moderate | 178 | 637 | 0 | 21.8 |
| C007 | Felt hungry but did not eat | Severe | 176 | 639 | 0 | 21.6 |
| C008 | Went without eating for a whole day | Severe | 74 | 741 | 0 | 9.1 |
| Source: SIVESNU 2018. Items ordered by increasing severity per FAO FIES methodology. | ||||||
Calculating Food Security Scores
Module 4: Covariate Prediction
Overview
Food security — the consistent access to sufficient, safe, and nutritious food — is a key determinant of child nutritional status. The Food Insecurity Experience Scale (FIES) captures household food security through eight questions of increasing severity, from worry about food availability to going entire days without eating.
FIES produces raw scores from 0 (food secure) to 8 (severe food insecurity). However, raw scores are ordinal — the difference between scores 1 and 2 is not necessarily equal to the difference between 7 and 8. To enable valid statistical modeling, we apply the Rasch model recommended by FAO, which transforms responses into interval-scale measurements where differences are comparable across the entire range.
FIES Item Response Distribution
The eight FIES items follow FAO’s standard ordering by severity. The expected pattern — decreasing affirmative responses as severity increases — is confirmed in SIVESNU data: 65% report worrying about food (mild), while only 9% report going a full day without eating (severe).
Rasch Model Estimation
The Rasch model is fit on the eight binary FIES responses using survey weights, following the FAO methodology for the Voices of the Hungry project. Two sets of parameters emerge from the estimation: item difficulty parameters (one per question, characterizing how severe the experience reported by each item is) and person severity parameters (one per raw score, mapping each total to an interval-scale food insecurity level).
Item Difficulty Parameters
Item difficulty (β) represents the severity threshold at which each experience is typically reported. Negative values indicate experiences reported by most respondents; positive values indicate experiences reported only by severely food insecure households.
| FIES Item Difficulty Parameters | ||||
| Rasch model estimates (ordered by difficulty) | ||||
| Rank | Code | Question | Severity | Difficulty (β) |
|---|---|---|---|---|
| 1 | C001 | Worried about not having enough food | Mild | −3.042 |
| 2 | C003 | Ate only a few kinds of foods | Mild | −1.582 |
| 3 | C002 | Unable to eat healthy/nutritious food | Mild | −1.356 |
| 4 | C005 | Ate less than should | Moderate | −0.091 |
| 5 | C006 | Household ran out of food | Moderate | 0.940 |
| 6 | C007 | Felt hungry but did not eat | Severe | 1.003 |
| 7 | C004 | Had to skip a meal | Moderate | 1.024 |
| 8 | C008 | Went without eating for a whole day | Severe | 3.104 |
| Higher difficulty = more severe food insecurity. Negative values = more common experiences. | ||||
Raw Score to Rasch Transformation
The model transforms each raw score (0-8) into an interval-scale severity parameter (θ). These parameters are used to assign individual food insecurity scores.
| FIES Severity Parameters by Raw Score | |||
| Rasch model transformation | |||
| Raw Score | Severity (θ) | Std. Error | Classification |
|---|---|---|---|
| 0 | −3.913 | 1.582 | Food Secure |
| 1 | −2.963 | 1.233 | Mild food insecurity |
| 2 | −1.746 | 1.014 | Mild food insecurity |
| 3 | −0.806 | 0.936 | Mild food insecurity |
| 4 | 0.034 | 0.900 | Moderate food insecurity |
| 5 | 0.842 | 0.906 | Moderate food insecurity |
| 6 | 1.724 | 0.989 | Moderate food insecurity |
| 7 | 2.927 | 1.241 | Severe food insecurity |
| 8 | 3.885 | 1.582 | Severe food insecurity |
| Classification follows FAO thresholds. | |||
Validation
Score Distribution Comparison
The following table shows the population distribution across raw scores and their corresponding Rasch transformation. Most children live in households experiencing some degree of food insecurity.
| FIES Score Distribution | ||||
| Raw scores mapped to Rasch severity parameters | ||||
| Raw Score | N | % (weighted) | Rasch Score (θ) | Classification |
|---|---|---|---|---|
| 0 | 219 | 26.3 | −3.913 | Food Secure |
| 1 | 123 | 15.3 | −2.963 | Mild food insecurity |
| 2 | 94 | 12.0 | −1.746 | Mild food insecurity |
| 3 | 103 | 12.6 | −0.806 | Mild food insecurity |
| 4 | 82 | 10.0 | 0.034 | Moderate food insecurity |
| 5 | 59 | 7.0 | 0.842 | Moderate food insecurity |
| 6 | 48 | 6.0 | 1.724 | Moderate food insecurity |
| 7 | 41 | 5.1 | 2.927 | Severe food insecurity |
| 8 | 46 | 5.8 | 3.885 | Severe food insecurity |
| Rasch scores provide interval-scale measurement; raw scores are ordinal. | ||||
Model Fit Statistics
| Rasch Model Fit Statistics | |
| Statistic | Value |
|---|---|
| Rasch Reliability (observed) | 0.744 |
| Rasch Reliability (flat) | 0.765 |
| Complete Cases | 550 |
| Convergence | Converged! |
| Reliability > 0.7 indicates acceptable measurement precision. | |
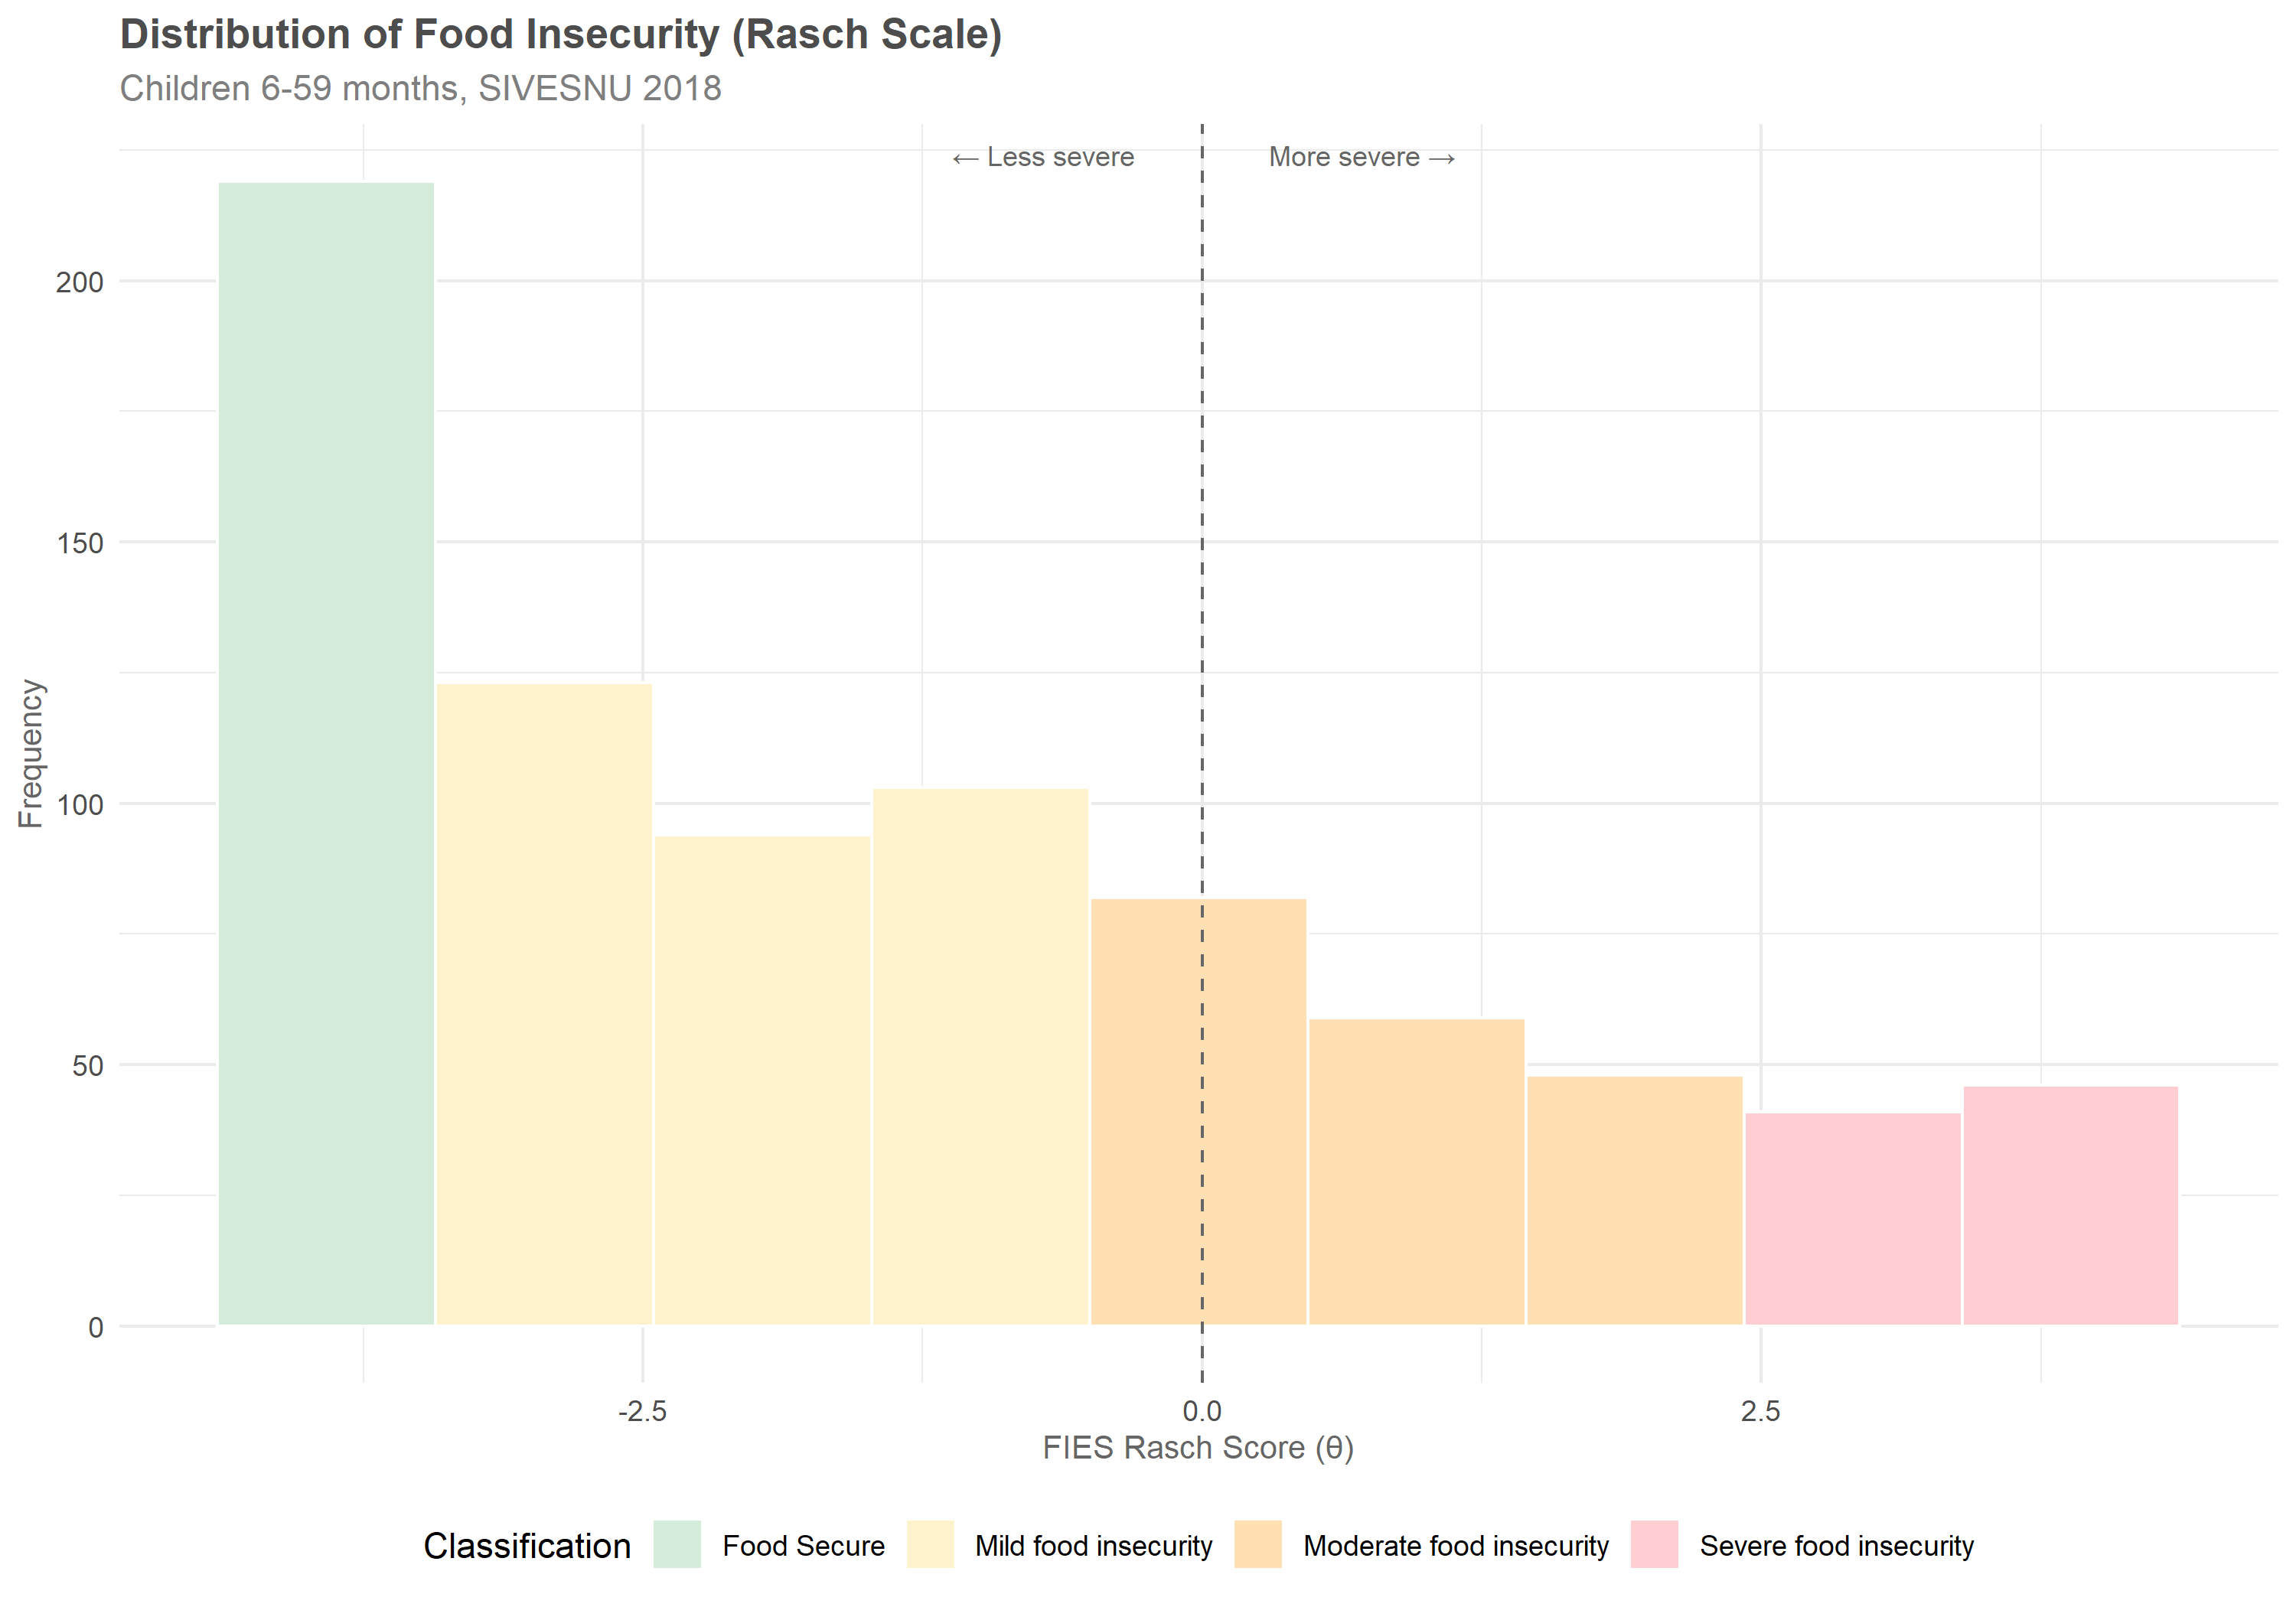
Distribution Visualization
The histogram shows the distribution of Rasch-transformed food insecurity scores. The bimodal pattern reflects distinct food secure and food insecure subpopulations.
Summary
Food Security Classification
| Classification | Raw Score | Prevalence |
|---|---|---|
| Food Secure | 0 | 26.3% |
| Mild food insecurity | 1-3 | 39.8% |
| Moderate food insecurity | 4-6 | 23.0% |
| Severe food insecurity | 7-8 | 10.9% |
Methodological Notes
Rasch model advantages — Transforms ordinal raw scores into interval-scale measurements with equal spacing. This enables valid arithmetic operations (means, regression coefficients) in subsequent modeling.
Survey-weighted estimation — Item parameters were estimated using survey weights to ensure population representativeness, following FAO methodology.
Item ordering validated — The estimated difficulty parameters follow the expected severity gradient: mild items (worry, diet quality) have negative β, while severe items (hunger, day without food) have positive β.
Limitations
Extreme scores — Raw scores 0 and 8 require assumptions for parameter estimation (handled by RM.weights default settings).
Local independence — The Rasch model assumes conditional independence between items given the latent trait; residual correlations may indicate violation.
Application
The Rasch-transformed FIES score enters the stunting models as a continuous predictor, carrying the full gradient of food security into the model rather than a small number of categorical strata.