| Chispitas Integration: Non-Maize Intake Before and After Adjustment | |||||||
| Expected delta by department (Fe and Zn only) | |||||||
| Department |
Iron (mg/day)
|
Zinc (mg/day)
|
Coverage | ||||
|---|---|---|---|---|---|---|---|
| Fe Original | Fe Adjusted | Δ Fe | Zn Original | Zn Adjusted | Δ Zn | ||
| Sololá | 5.206 | 7.386 | 2.180 | 2.602 | 3.496 | 0.894 | 91.0% |
| Chiquimula | 3.784 | 5.850 | 2.065 | 1.728 | 2.575 | 0.847 | 86.2% |
| Chimaltenango | 5.451 | 7.483 | 2.032 | 2.508 | 3.341 | 0.833 | 84.8% |
| Jutiapa | 5.850 | 7.817 | 1.967 | 2.714 | 3.520 | 0.807 | 82.1% |
| Petén | 4.258 | 6.158 | 1.900 | 1.906 | 2.685 | 0.779 | 79.3% |
| Sacatepéquez | 5.434 | 7.298 | 1.864 | 2.664 | 3.428 | 0.764 | 77.8% |
| Escuintla | 6.097 | 7.954 | 1.857 | 3.014 | 3.775 | 0.761 | 77.5% |
| Totonicapán | 4.910 | 6.739 | 1.828 | 2.068 | 2.817 | 0.750 | 76.3% |
| Alta Verapaz | 4.092 | 5.810 | 1.718 | 1.753 | 2.457 | 0.704 | 71.7% |
| Santa Rosa | 6.634 | 8.347 | 1.713 | 3.244 | 3.947 | 0.702 | 71.5% |
| El Progreso | 5.493 | 7.158 | 1.665 | 2.590 | 3.273 | 0.683 | 69.5% |
| Baja Verapaz | 4.655 | 6.286 | 1.632 | 2.082 | 2.751 | 0.669 | 68.1% |
| Jalapa | 7.673 | 9.199 | 1.526 | 3.159 | 3.785 | 0.626 | 63.7% |
| Retalhuleu | 5.566 | 7.042 | 1.476 | 2.736 | 3.342 | 0.605 | 61.6% |
| Quiché | 4.450 | 5.923 | 1.474 | 1.853 | 2.457 | 0.604 | 61.5% |
| Quetzaltenango | 5.398 | 6.759 | 1.361 | 3.031 | 3.589 | 0.558 | 56.8% |
| Zacapa | 4.062 | 5.332 | 1.270 | 1.879 | 2.400 | 0.521 | 53.0% |
| Suchitepéquez | 5.433 | 6.590 | 1.157 | 2.471 | 2.946 | 0.474 | 48.3% |
| Huehuetenango | 6.072 | 7.160 | 1.088 | 2.436 | 2.882 | 0.446 | 45.4% |
| San Marcos | 4.801 | 5.757 | 0.956 | 2.165 | 2.557 | 0.392 | 39.9% |
| Guatemala | 5.158 | 6.028 | 0.870 | 2.518 | 2.875 | 0.357 | 36.3% |
| Izabal | 4.289 | 4.789 | 0.501 | 2.027 | 2.232 | 0.205 | 20.9% |
| Coverage: INE 2022. Adherence: 0.719 (SIVESNU 2018). Composition: 3.33 mg Fe, 1.37 mg Zn per day. | |||||||
Bioavailability and Nutrient Inadequacy
Module 5: Meta-analysis
Why Calculate Bioavailability and Inadequacy?
Raw nutrient intake values do not directly indicate nutrient adequacy. Iron and zinc pass through absorption processes that reduce the fraction available to the body, and the thresholds for adequacy vary by age. This module bridges dietary intake and nutrient adequacy by applying bioavailability corrections and classifying each child under two conditions: baseline (conventional maize) and QPM intervention (biofortified maize at 100% coverage).
The QPM intervention pre-computes the full nutritional recalculation at the individual level, so that downstream scenario scripts only need to select which children are impacted by a given production coverage level.
Parameters and Data
The analysis requires four sets of parameters: the Miller equation coefficients for zinc absorption in children, the iron absorption factor for plant-based diets, age-specific nutrient inadequacy thresholds (H-AR), and the QPM biofortification factors from the Semilla Nueva Standard Report (2020).
NoteBioavailability Models
Iron uses a uniform 5% absorption factor (Allen et al., 2006) appropriate for the predominantly plant-based dietary patterns in this population. Zinc uses the age-dependent Miller equation (Miller et al., 2015), which captures saturation kinetics where fractional absorption decreases at higher intakes. Protein quality is assessed via PDCAAS adjustment applied at the food level during the intake calculation.
Chispitas Supplementation Integration
Guatemala’s Chispitas program distributes Multiple Micronutrient Powder (MNP) sachets to children aged 6-59 months through the public health system. Each sachet contains 10 mg iron and 4.1 mg zinc, administered in 60-day cycles every ~180 days. To convert episodic supplementation to average daily contribution, a 1/3 adjustment factor is applied (60 active days / 180 day cycle), yielding 3.33 mg Fe/day and 1.37 mg Zn/day during active periods.
ENCOVI 2023 records dietary intake and does not capture supplementation, so the expected Chispitas contribution is estimated from external sources. The integration uses:
- Departmental coverage rates: Official INE population projections (2022), representing the proportion of children 6-59 months receiving first Chispitas delivery by department.
- National adherence factor: 0.719, the survey-weighted mean of the adherence estimated in Chispitas Supplementation, taken over the SIVESNU 2018 children recorded as programme recipients. The adherence cascade reflects sequential filtering through access, administration, and dosing compliance.
The expected daily contribution per child is computed as the product of composition, departmental coverage, and national adherence, and is added to each child’s non-maize iron and zinc intake. Chispitas contains no protein, so protein intake variables remain unchanged.
Source of the adherence factor: SIVESNU 2018 is the nationally representative source of Chispitas adherence data for Guatemala.
Implausible Intake Detection and Treatment
Two screens flag a record as implausible.
Maize ceiling. Maize energy intake above 2,500 kcal/day is physiologically implausible for children aged 6-59 months. The ceiling corresponds to approximately 685 g/day of nixtamalized maize at 3.65 kcal/g (INCAP) and exceeds the total daily energy requirement for any child in this age range. The FAO Food Balance Sheet for Guatemala reports 226 g/capita/day of maize for adults.
Non-maize screen. The upper tail of the non-maize distribution reaches values far above the median, so each non-maize component — iron, zinc, lysine, tryptophan and energy — is screened against its own upper Tukey fence at \(Q3 + 3 \times IQR\). The multiplier is 3 rather than the usual 1.5 because the rule declares a record implausible and triggers imputation: on non-maize energy it places the cut at a level that, from non-maize sources alone, already exceeds the total energy requirement for this age range.
The ENCOVI 2023 food consumption module records intake at the household level and distributes it to individuals via AME coefficients, so an implausible value on either side signals unreliable data across the entire nutrient profile. The treatment invalidates all twelve source-specific nutrient variables plus maize and non-maize grams for the flagged records, and imputes plausible values via k-nearest neighbours (RANN k-d tree, k = 10, inverse-distance weighting).
Predictors. The imputation is conditioned on the child’s own ENCOVI record: age, sex, department, area, household education and the plant-source share of the diet. The quantity being reconstructed is an ENCOVI dietary value, so it is rebuilt from variables observed for the same child in the same survey.
Five of the six are collected outside the food consumption module. The plant-source share is a composition ratio derived from it, and is retained on that basis: the reporting error the screen targets scales the reported quantities of a household and leaves their relative composition intact, so the ratio carries dietary-pattern signal that survives the error invalidating the amounts.
The set carries one variable per dimension of the matching space — demographics, geography, socioeconomic position and diet composition. All are continuous or binary, which keeps the scaled Euclidean metric well defined and leaves each dimension weighted once.
| Implausible Intake Detection | |||
| Maize ceiling: 2,500 kcal/day (= 685 g/day) | non-maize: Q3 + 3·IQR per component | |||
| Department | N Total | N Flagged | % Flagged |
|---|---|---|---|
| National | |||
| NATIONAL | 4,065 | 558 | 13.7 |
| By Department | |||
| Baja Verapaz | 203 | 52 | 25.6 |
| Chiquimula | 136 | 31 | 22.8 |
| Jalapa | 196 | 44 | 22.4 |
| San Marcos | 204 | 38 | 18.6 |
| Quiché | 274 | 51 | 18.6 |
| Petén | 200 | 35 | 17.5 |
| Izabal | 191 | 33 | 17.3 |
| Totonicapán | 194 | 30 | 15.5 |
| Alta Verapaz | 247 | 38 | 15.4 |
| Santa Rosa | 117 | 16 | 13.7 |
| Huehuetenango | 207 | 28 | 13.5 |
| Quetzaltenango | 174 | 22 | 12.6 |
| Retalhuleu | 138 | 17 | 12.3 |
| Suchitepéquez | 223 | 24 | 10.8 |
| Jutiapa | 173 | 17 | 9.8 |
| Escuintla | 208 | 18 | 8.7 |
| El Progreso | 138 | 11 | 8.0 |
| Chimaltenango | 204 | 15 | 7.4 |
| Zacapa | 151 | 11 | 7.3 |
| Guatemala | 173 | 12 | 6.9 |
| Sololá | 146 | 10 | 6.8 |
| Sacatepéquez | 168 | 5 | 3.0 |
| Conversion: 3.65 kcal/g (INCAP, nixtamalized maize tortilla). FAO FBS Guatemala: 226 g/capita/day (adults). | |||
| Sensitivity Analysis: Maize Energy Ceiling | |||
| Impact of threshold selection on flagging rate | |||
| Ceiling (kcal/day) | Equiv. g/day | N Flagged | % Flagged |
|---|---|---|---|
| 1,000 | 274 | 1,189 | 29.2 |
| 1,500 | 411 | 817 | 20.1 |
| 2,000 | 548 | 621 | 15.3 |
| 2,500 | 685 | 467 | 11.5 |
| 3,500 | 959 | 288 | 7.1 |
| Highlighted row: selected ceiling. Conversion: 3.65 kcal/g nixtamalized maize (INCAP). | |||
ImportantThreshold Selection
The 2,500 kcal/day ceiling, together with the non-maize screen, flags 558 records nationally (13.7%). The sensitivity analysis places the maize component in the range of available options: a 1,000 kcal/day ceiling would flag 29.2% of records on that criterion alone and a 3,500 kcal/day ceiling 7.1%. The selected value sits above the total daily energy requirement of a child in this age range, which is what makes it implausible rather than merely high. Flagging rates reach 25.6% in Baja Verapaz, against 3% at the lower end, so the affected records are concentrated geographically.
Imputation Diagnostics
| Post-Imputation Diagnostic: Valid vs Outlier vs Imputed | |||||
| N flagged: 558 (13.7%) | k = 10, inverse-distance weighted | |||||
| Source | Mean | Median | SD | Max | P95 |
|---|---|---|---|---|---|
| gr_individuo_dia_maiz | |||||
| Valid | 158.49 | 98.94 | 161.51 | 684.23 | 530.12 |
| Original outlier | 1,544.86 | 977.76 | 3,575.73 | 52,050.73 | 3,601.77 |
| Imputed (k-NN) | 227.97 | 232.81 | 93.42 | 526.18 | 375.97 |
| kcal_individuo_dia_maiz | |||||
| Valid | 578.51 | 361.13 | 589.52 | 2,497.43 | 1,934.93 |
| Original outlier | 5,638.75 | 3,568.81 | 13,051.41 | 189,985.17 | 13,146.48 |
| Imputed (k-NN) | 832.10 | 849.77 | 341.00 | 1,920.57 | 1,372.29 |
| fe_individuo_dia_maiz | |||||
| Valid | 4.30 | 2.68 | 4.38 | 18.54 | 14.37 |
| Original outlier | 41.87 | 26.50 | 96.90 | 1,410.57 | 97.61 |
| Imputed (k-NN) | 6.18 | 6.31 | 2.53 | 14.26 | 10.19 |
| zn_individuo_dia_maiz | |||||
| Valid | 3.50 | 2.19 | 3.57 | 15.12 | 11.72 |
| Original outlier | 34.14 | 21.61 | 79.02 | 1,150.32 | 79.60 |
| Imputed (k-NN) | 5.04 | 5.15 | 2.06 | 11.63 | 8.31 |
| prot_apro_individuo_dia_maiz | |||||
| Valid | 6.72 | 4.19 | 6.85 | 29.00 | 22.47 |
| Original outlier | 65.49 | 41.45 | 151.58 | 2,206.43 | 152.68 |
| Imputed (k-NN) | 9.66 | 9.87 | 3.96 | 22.30 | 15.94 |
| Valid: non-flagged records. Original: pre-invalidation values. Imputed: k-NN RANN replacement. | |||||
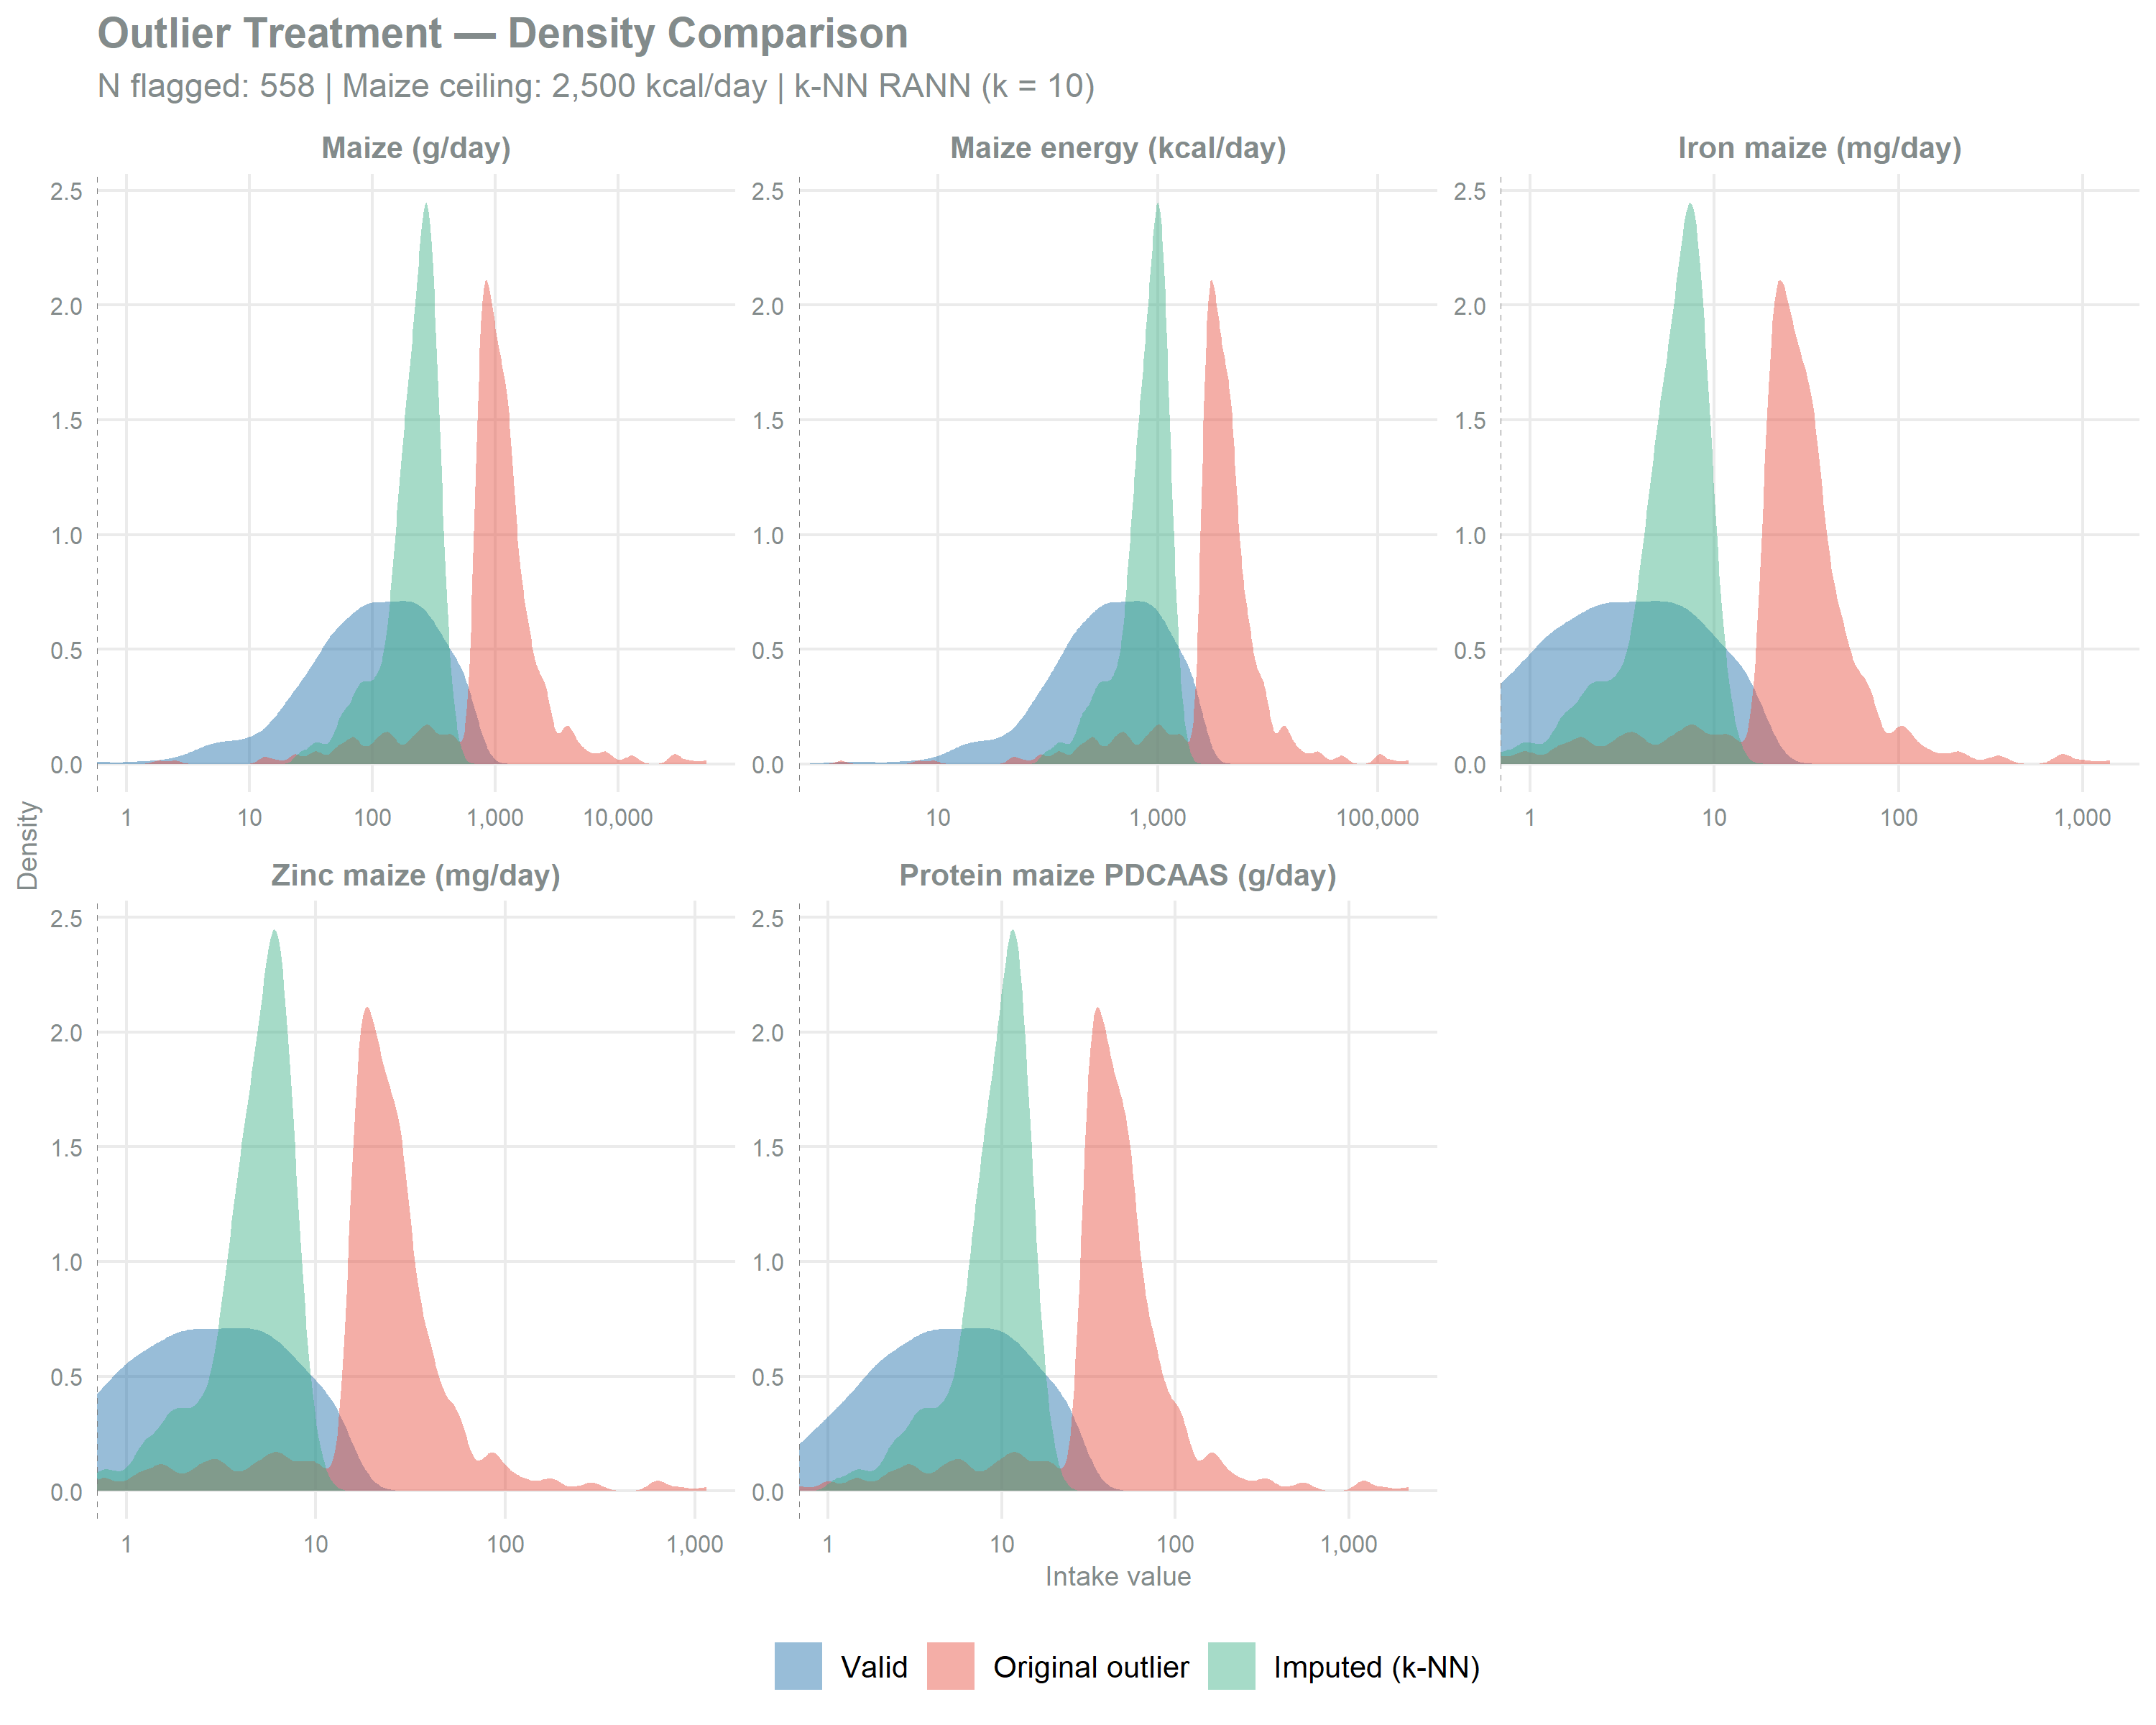
NoteWhere the Imputed Values Land
The k-NN imputation (k = 10, inverse-distance weighted) places the replaced records inside the range of the valid ones. Mean maize intake is 228 g/day among the imputed records against 158 g/day among the valid ones, where the original flagged values averaged 1,545 g/day. The same ordering holds for the other four variables. Imputed values are less dispersed than valid ones, which is the expected behaviour of a neighbour average.
Non-Maize Protein Outlier Treatment
Digestible protein from non-maize sources carries a heavy right tail in the dietary intake distribution. A small fraction of children report non-maize protein intake above its upper Tukey fence, and those values propagate into the protein totals.
Protein is screened on its own axis, once the block treatment above has settled the rest of the nutrient profile. The criterion targets the tail of a single component rather than a systematically unreliable record, so the fence multiplier is 1.5 rather than the 3 used for the block screen. Records above the fence are replaced via k-NN imputation with the same predictor set and the same weighting; only the non-maize protein variable is invalidated and imputed, and every other nutrient variable is carried through unchanged.
| Non-Maize Protein Outlier Detection | |
| Tukey criterion (Q3 + 1.5 × IQR) on non-maize digestible protein | |
| Metric | Value |
|---|---|
| Tukey fence (g/day) | 24.5 |
| Children exceeding fence | 179.0 |
| Total children | 4065.0 |
| Percentage flagged | 4.4 |
| Upper Tukey fence on the non-maize digestible protein distribution of the analytical cohort. | |
| Non-Maize Protein: Imputation Diagnostics | ||||
| 179 records imputed (4.4%) | Fence: 24.5 g/day | ||||
| Source | N | Mean | Median | Max |
|---|---|---|---|---|
| Valid (non-flagged) | 3,886 | 8.15 | 6.94 | 24.33 |
| Original outliers | 179 | 30.53 | 29.29 | 45.08 |
| Imputed (k-NN) | 179 | 12.28 | 12.24 | 18.73 |
| k-NN RANN (k = 10, inverse-distance weighted). Same predictors as the block imputation. | ||||
Baseline Bioavailability Calculations
Total nutrient intake is calculated by aggregating maize and non-maize sources. The Miller equation estimates Total Absorbed Zinc (TAZ) as a function of age and total dietary zinc, capturing saturation kinetics. Iron bioavailability applies a uniform 5% absorption factor.
Baseline Nutrient Inadequacy Classification
Each child’s bioavailable nutrient intake is compared against age-specific H-AR thresholds. Iron uses a uniform threshold (0.5 mg/day absorbed), zinc uses three EFSA age bands (EFSA Panel on Dietetic Products, Nutrition and Allergies, 2014), and protein uses two WHO/FAO age bands (World Health Organization et al., 2007). A child is classified as adequate or inadequate for each nutrient independently.
Baseline Diagnostic Results
Bioavailability by Age Group
| Micronutrient Intake and Bioavailability by Age Group — Baseline | |||||||||||||
| ENCOVI 2023, children 6-59 months (survey-weighted) | |||||||||||||
| Age Group | N |
Iron (mg/d)
|
Zinc (mg/d)
|
Protein (g/d)
|
|||||||||
|---|---|---|---|---|---|---|---|---|---|---|---|---|---|
| Fe Intake | 95% CI | Fe Absorbed | 95% CI | Zn Intake | 95% CI | TAZ | 95% CI | Zn Abs % | 95% CI | Protein | 95% CI | ||
| 6-11 mo | 421 | 7.63 | [7.05, 8.215] | 0.38 | [0.35, 0.4107] | 4.73 | [4.29, 5.175] | 0.68 | [0.65, 0.7044] | 18.1 | [17.3, 18.84] | 10.96 | [10.07, 11.85] |
| 12-23 mo | 844 | 8.78 | [8.33, 9.221] | 0.44 | [0.42, 0.4610] | 5.32 | [5.00, 5.642] | 0.88 | [0.86, 0.9060] | 20.7 | [20.1, 21.31] | 13.27 | [12.57, 13.97] |
| 24-35 mo | 902 | 10.45 | [9.96, 10.945] | 0.52 | [0.50, 0.5472] | 6.39 | [6.03, 6.750] | 1.11 | [1.08, 1.1367] | 21.7 | [21.0, 22.31] | 15.58 | [14.81, 16.35] |
| 36-47 mo | 865 | 10.70 | [10.28, 11.120] | 0.53 | [0.51, 0.5560] | 6.45 | [6.14, 6.756] | 1.25 | [1.22, 1.2786] | 23.3 | [22.7, 23.88] | 16.18 | [15.50, 16.87] |
| 48-59 mo | 1033 | 11.90 | [11.47, 12.334] | 0.60 | [0.57, 0.6167] | 7.15 | [6.85, 7.447] | 1.41 | [1.38, 1.4364] | 23.5 | [22.9, 24.04] | 18.33 | [17.65, 19.02] |
| N: unweighted sample size. All estimates survey-weighted. | |||||||||||||
| Iron: 5% uniform absorption (Allen et al., 2006). Zinc: Miller equation (age-dependent). | |||||||||||||
Inadequacy Prevalence by Age Group and Sex
| Nutrient Inadequacy Prevalence — Baseline | |||||||||||
| ENCOVI 2023, children 6-59 months by age group and sex (survey-weighted) | |||||||||||
| Sex | N |
Inadequacy Prevalence (%)
|
Combined (%)
|
||||||||
|---|---|---|---|---|---|---|---|---|---|---|---|
| Iron | 95% CI | Zinc | 95% CI | Protein | 95% CI | Any | 95% CI | All 3 | 95% CI | ||
| 6-11 mo | |||||||||||
| Female | 198 | 71.3 | [62.4, 80.26] | 52.7 | [43.1, 62.21] | 64.3 | [55.3, 73.31] | 71.5 | [62.6, 80.40] | 51.2 | [41.7, 60.71] |
| Male | 223 | 79.8 | [73.5, 86.19] | 61.5 | [52.7, 70.33] | 72.8 | [65.4, 80.28] | 80.1 | [73.8, 86.45] | 59.9 | [51.0, 68.80] |
| 12-23 mo | |||||||||||
| Female | 415 | 69.1 | [63.5, 74.60] | 78.8 | [73.9, 83.62] | 55.6 | [49.4, 61.68] | 80.0 | [75.2, 84.83] | 53.3 | [47.1, 59.48] |
| Male | 429 | 67.9 | [61.5, 74.29] | 72.9 | [67.7, 78.14] | 54.3 | [46.5, 62.21] | 74.5 | [69.4, 79.55] | 51.9 | [44.1, 59.68] |
| 24-35 mo | |||||||||||
| Female | 430 | 52.3 | [46.0, 58.56] | 41.9 | [35.6, 48.15] | 41.3 | [35.3, 47.28] | 54.9 | [48.6, 61.08] | 34.3 | [28.3, 40.19] |
| Male | 472 | 53.9 | [48.2, 59.50] | 41.6 | [35.8, 47.50] | 43.5 | [37.8, 49.24] | 56.1 | [50.5, 61.69] | 36.5 | [30.7, 42.35] |
| 36-47 mo | |||||||||||
| Female | 420 | 53.7 | [47.5, 59.82] | 64.6 | [58.8, 70.51] | 70.3 | [64.5, 76.07] | 77.1 | [71.9, 82.29] | 50.1 | [43.9, 56.31] |
| Male | 445 | 45.6 | [40.0, 51.25] | 57.4 | [51.8, 62.91] | 64.4 | [59.2, 69.55] | 69.8 | [64.8, 74.76] | 42.5 | [36.8, 48.09] |
| 48-59 mo | |||||||||||
| Female | 506 | 39.7 | [34.1, 45.22] | 40.5 | [35.1, 46.02] | 58.5 | [53.2, 63.84] | 64.3 | [59.2, 69.40] | 31.1 | [26.0, 36.30] |
| Male | 527 | 36.9 | [31.3, 42.50] | 36.9 | [31.3, 42.38] | 53.8 | [48.1, 59.40] | 58.7 | [53.2, 64.18] | 31.4 | [26.0, 36.73] |
| N: unweighted sample size. All estimates survey-weighted. | |||||||||||
| Inadequacy: intake below age-specific threshold. | |||||||||||
ImportantBaseline Inadequacy
Nationally the three nutrients sit close together: iron at 54.2%, zinc at 53.6% and protein at 56.5% (see Table 10), with 67.4% of children inadequate in at least one of them. The ordering is not stable across strata: in Table 8 iron is the most prevalent in 4 of the 10 age-sex strata, and the remaining strata are led by zinc or protein.
Adequacy Ratio Distributions
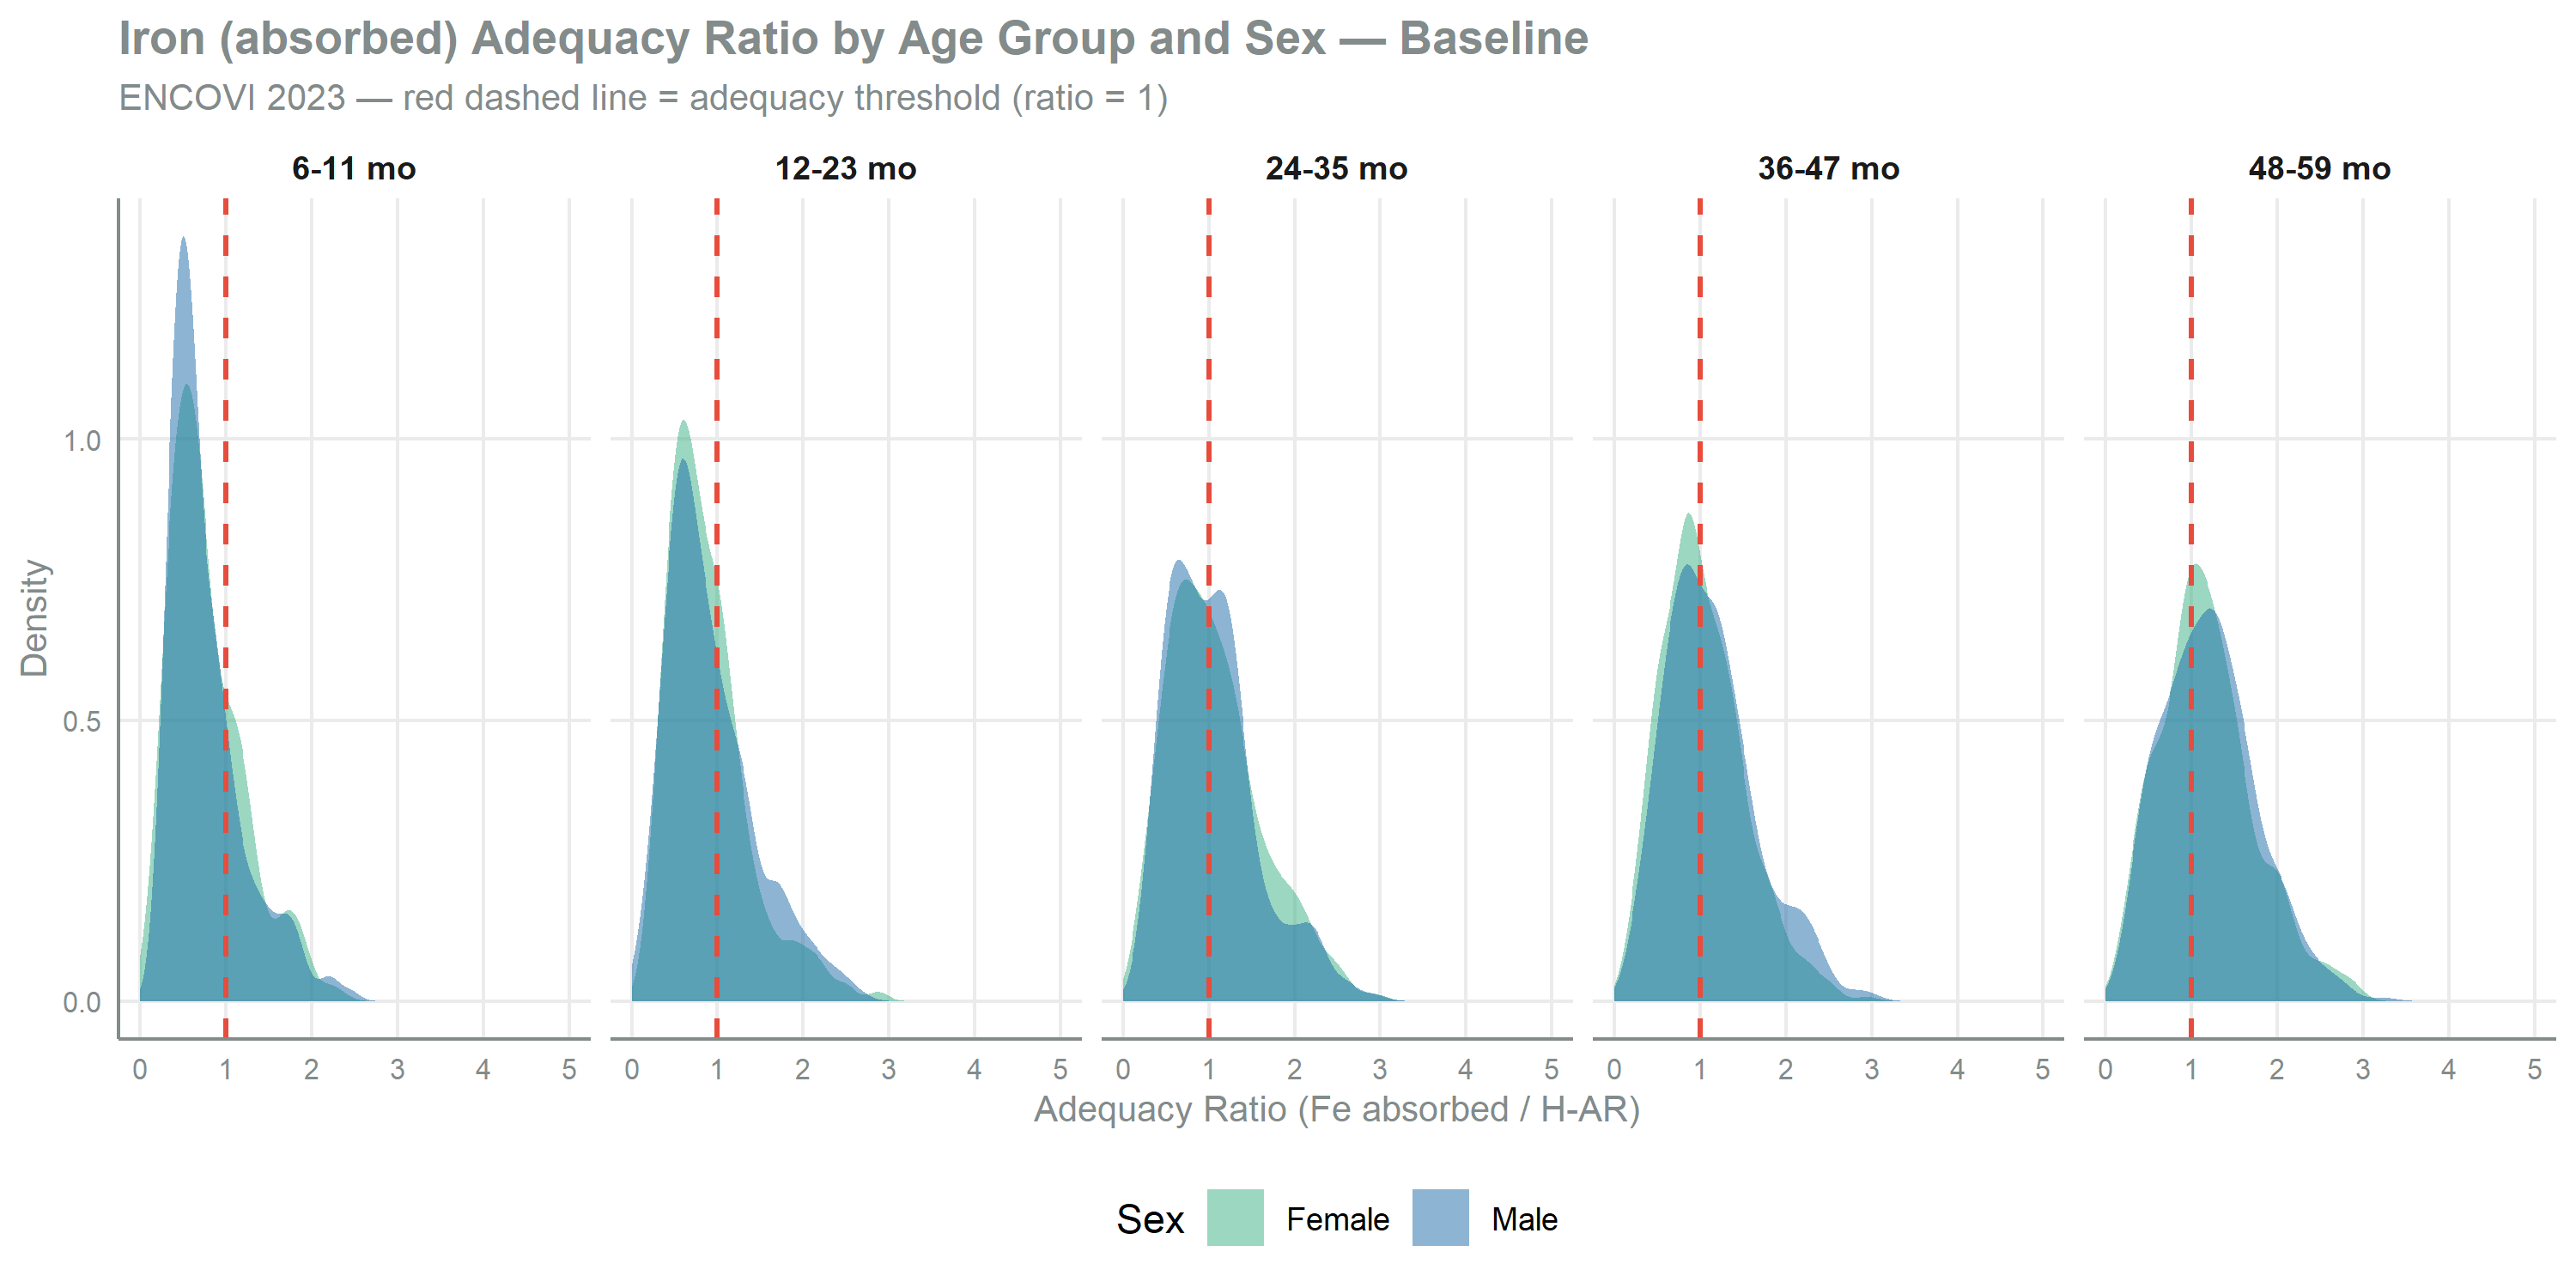
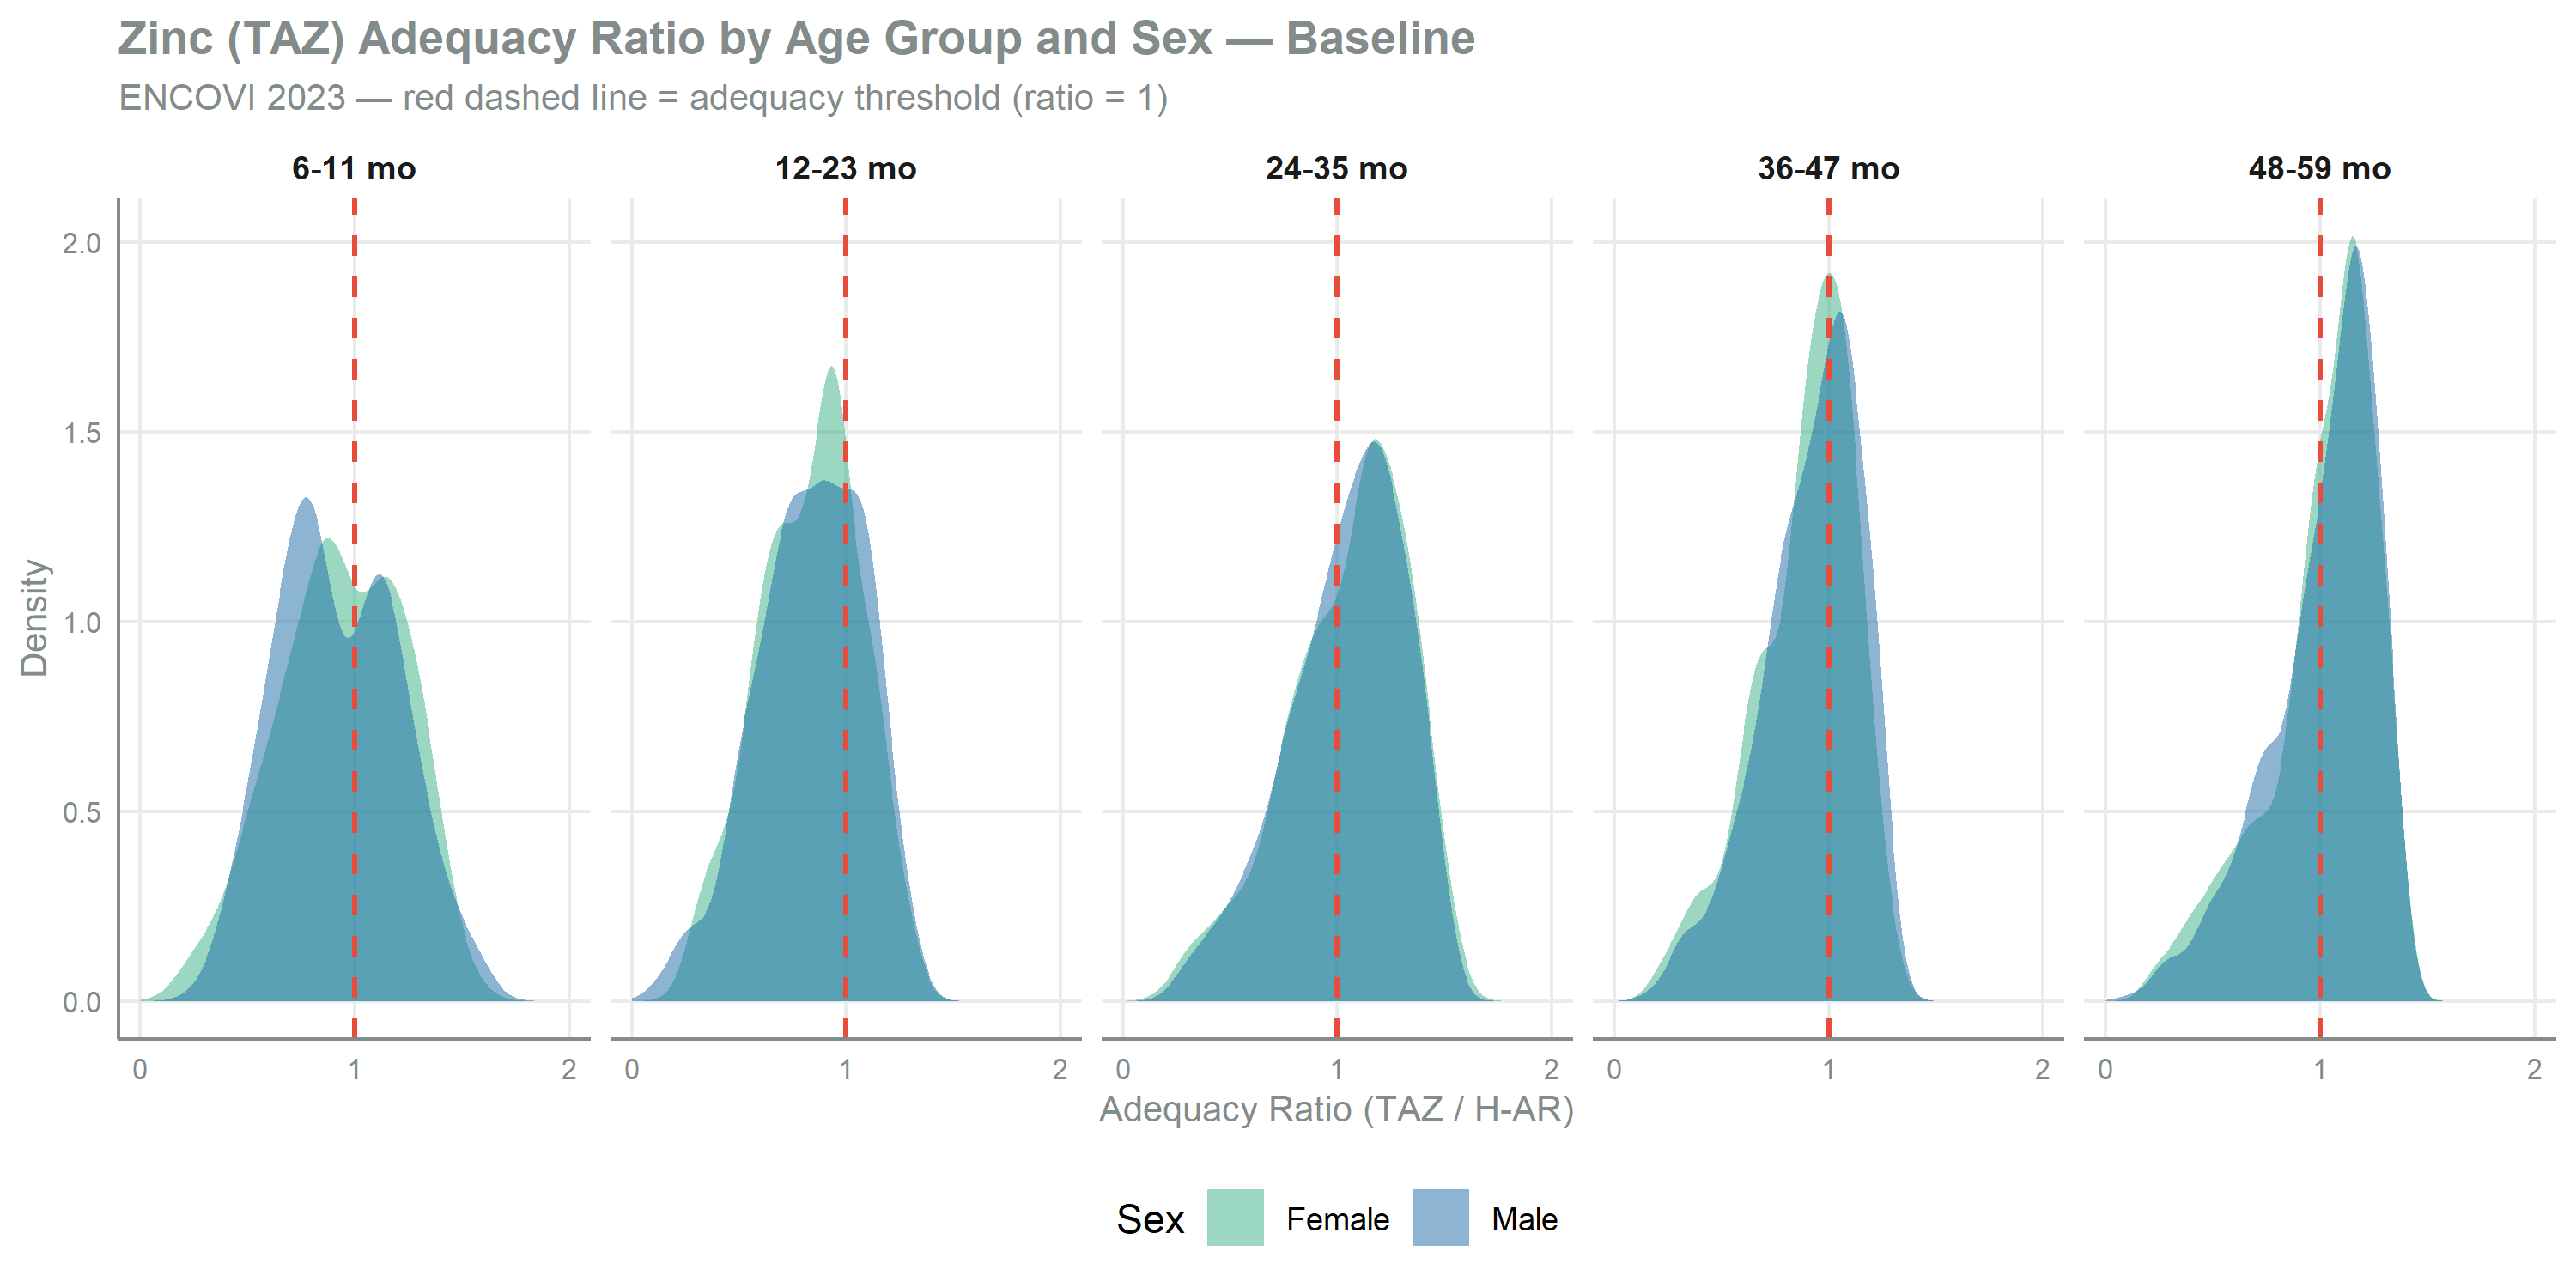
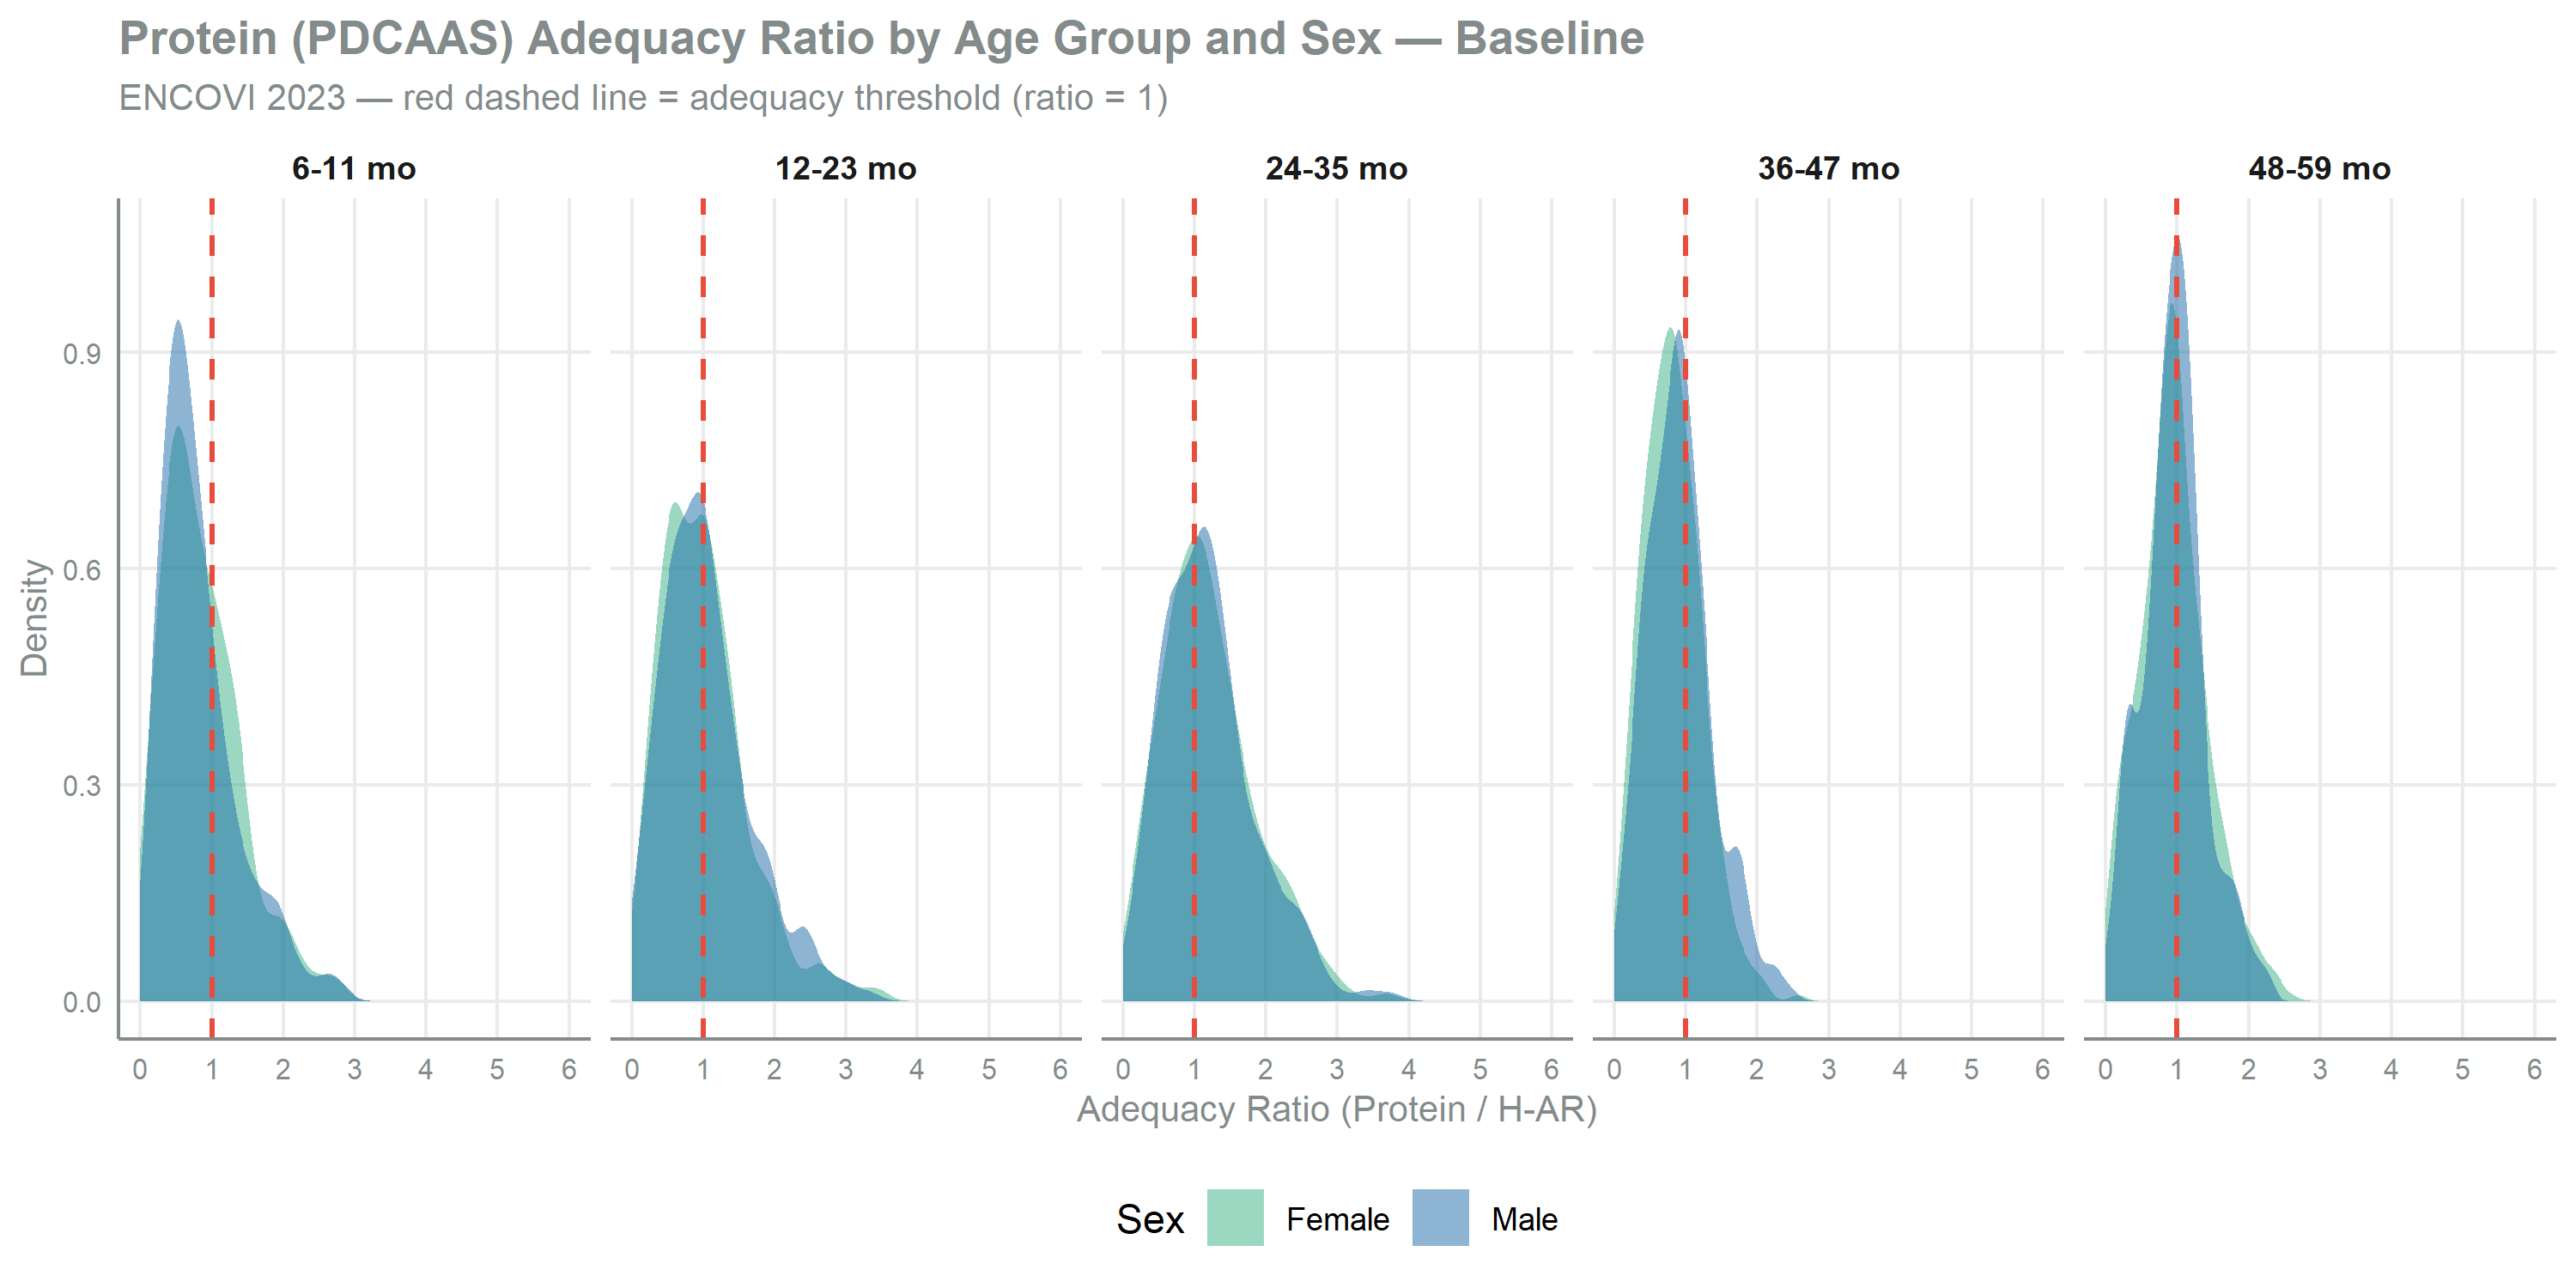
Stunting and Inadequacy Relationship
| Stunting Prevalence by Number of Nutrient Inadequacies — Baseline | |||||||
| ENCOVI 2023, children 6-59 months (survey-weighted) | |||||||
| Inadequacy Status | N | Maize (g/day) | % Rural | Stunting % | 95% CI | Mean HAZ | 95% CI |
|---|---|---|---|---|---|---|---|
| No inadequacy | 1371 | 329 | 64.8 | 56.4 | [52.0, 60.71] | −2.11 | [−2.19, -2.036] |
| 1 nutrient | 521 | 178 | 57.0 | 50.3 | [44.2, 56.30] | −2.00 | [−2.10, -1.896] |
| 2 nutrients | 459 | 98 | 48.2 | 35.5 | [29.6, 41.54] | −1.75 | [−1.86, -1.642] |
| 3 nutrients | 1714 | 59 | 48.5 | 45.8 | [41.7, 49.91] | −1.93 | [−1.99, -1.863] |
| Stunting: HAZ < -2 (WHO classification). Inadequacy: intake below H-AR. Maize intake and rural share shown to characterise the socioeconomic profile of each group. | |||||||
NoteNon-Monotonic Pattern
Stunting prevalence does not increase monotonically with the number of current nutrient inadequacies (see Table 9): the highest prevalence, 56.4%, falls on the “No inadequacy” group and the lowest, 35.5%, on the “2 nutrients” group.
The children with no current inadequacy are the heaviest maize consumers, at a mean of 329 g/day against 178 g/day or less in the other groups. Maize is the main dietary source of iron, zinc and protein in this population, so a maize-dominated diet clears the adequacy thresholds, which is what places these children in the “no inadequacy” group. The same group is the most rural, at 64.8%, and carries the lowest mean height-for-age, at -2.11. Chronic undernutrition is associated with conditions that current nutrient adequacy does not measure, among them sanitation, infection burden and dietary diversity. Maize dependence sits on both sides at once, as a source of nutrient adequacy and as a marker of that profile, which is what produces the ordering in the table.
QPM Intervention (100% Coverage)
Biofortification factors are applied to maize-source nutrients (Fe ×1.19, Zn ×1.38, Protein ×1.94), and the entire bioavailability and inadequacy pipeline is recalculated under the intervention scenario. This represents the maximum individual-level benefit assuming all maize is replaced by QPM varieties.
The protein factor of 1.94 carries protein quality, not protein quantity. Conventional plant breeding leaves total protein content per gram of maize unchanged and increases the proportion of lysine and tryptophan within that protein, which raises the protein digestibility-corrected amino acid score (PDCAAS) of QPM-source protein from 0.317 to 0.616. This factor is applied to the PDCAAS-adjusted protein intake variable already computed at the food level in the intake calculation, so the protein values entering the inadequacy pipeline carry the quality change. Lysine and tryptophan enter this pathway through that same index and carry no separate factor of their own, which keeps the amino acid profile counted once.
Baseline vs QPM Inadequacy
| Nutrient Inadequacy: Baseline vs. QPM Intervention (100% Coverage) | ||||
| ENCOVI 2023, children 6-59 months — Maximum potential impact (all maize biofortified) | ||||
| Nutrient | Baseline Inad. (%) | QPM Inad. (%) | Cases Resolved (%) | Change (pp) |
|---|---|---|---|---|
| Iron (absorbed) | 54.2 | 49.9 | 4.3 | −4.3 |
| Zinc (TAZ) | 53.6 | 45.2 | 8.4 | −8.4 |
| Protein (PDCAAS) | 56.5 | 37.2 | 19.3 | −19.3 |
| Any nutrient | 67.4 | 54.4 | 13.0 | −13.0 |
| QPM factors: Fe ×1.19, Zn ×1.38, Protein ×1.94 (PDCAAS). All estimates survey-weighted. | ||||
| Cases resolved: children moving from inadequate (baseline) to adequate (QPM). | ||||
NoteQPM Impact at Full Coverage
At 100% biofortified maize coverage, protein inadequacy falls by 19.3 percentage points, zinc by 8.4 and iron by 4.3, taking the share of children inadequate in at least one nutrient from 67.4% to 54.4% (see Table 10). The protein figure follows the PDCAAS change in QPM, from 0.317 to 0.616, a factor of 1.94 on the quality-adjusted protein reaching the child.
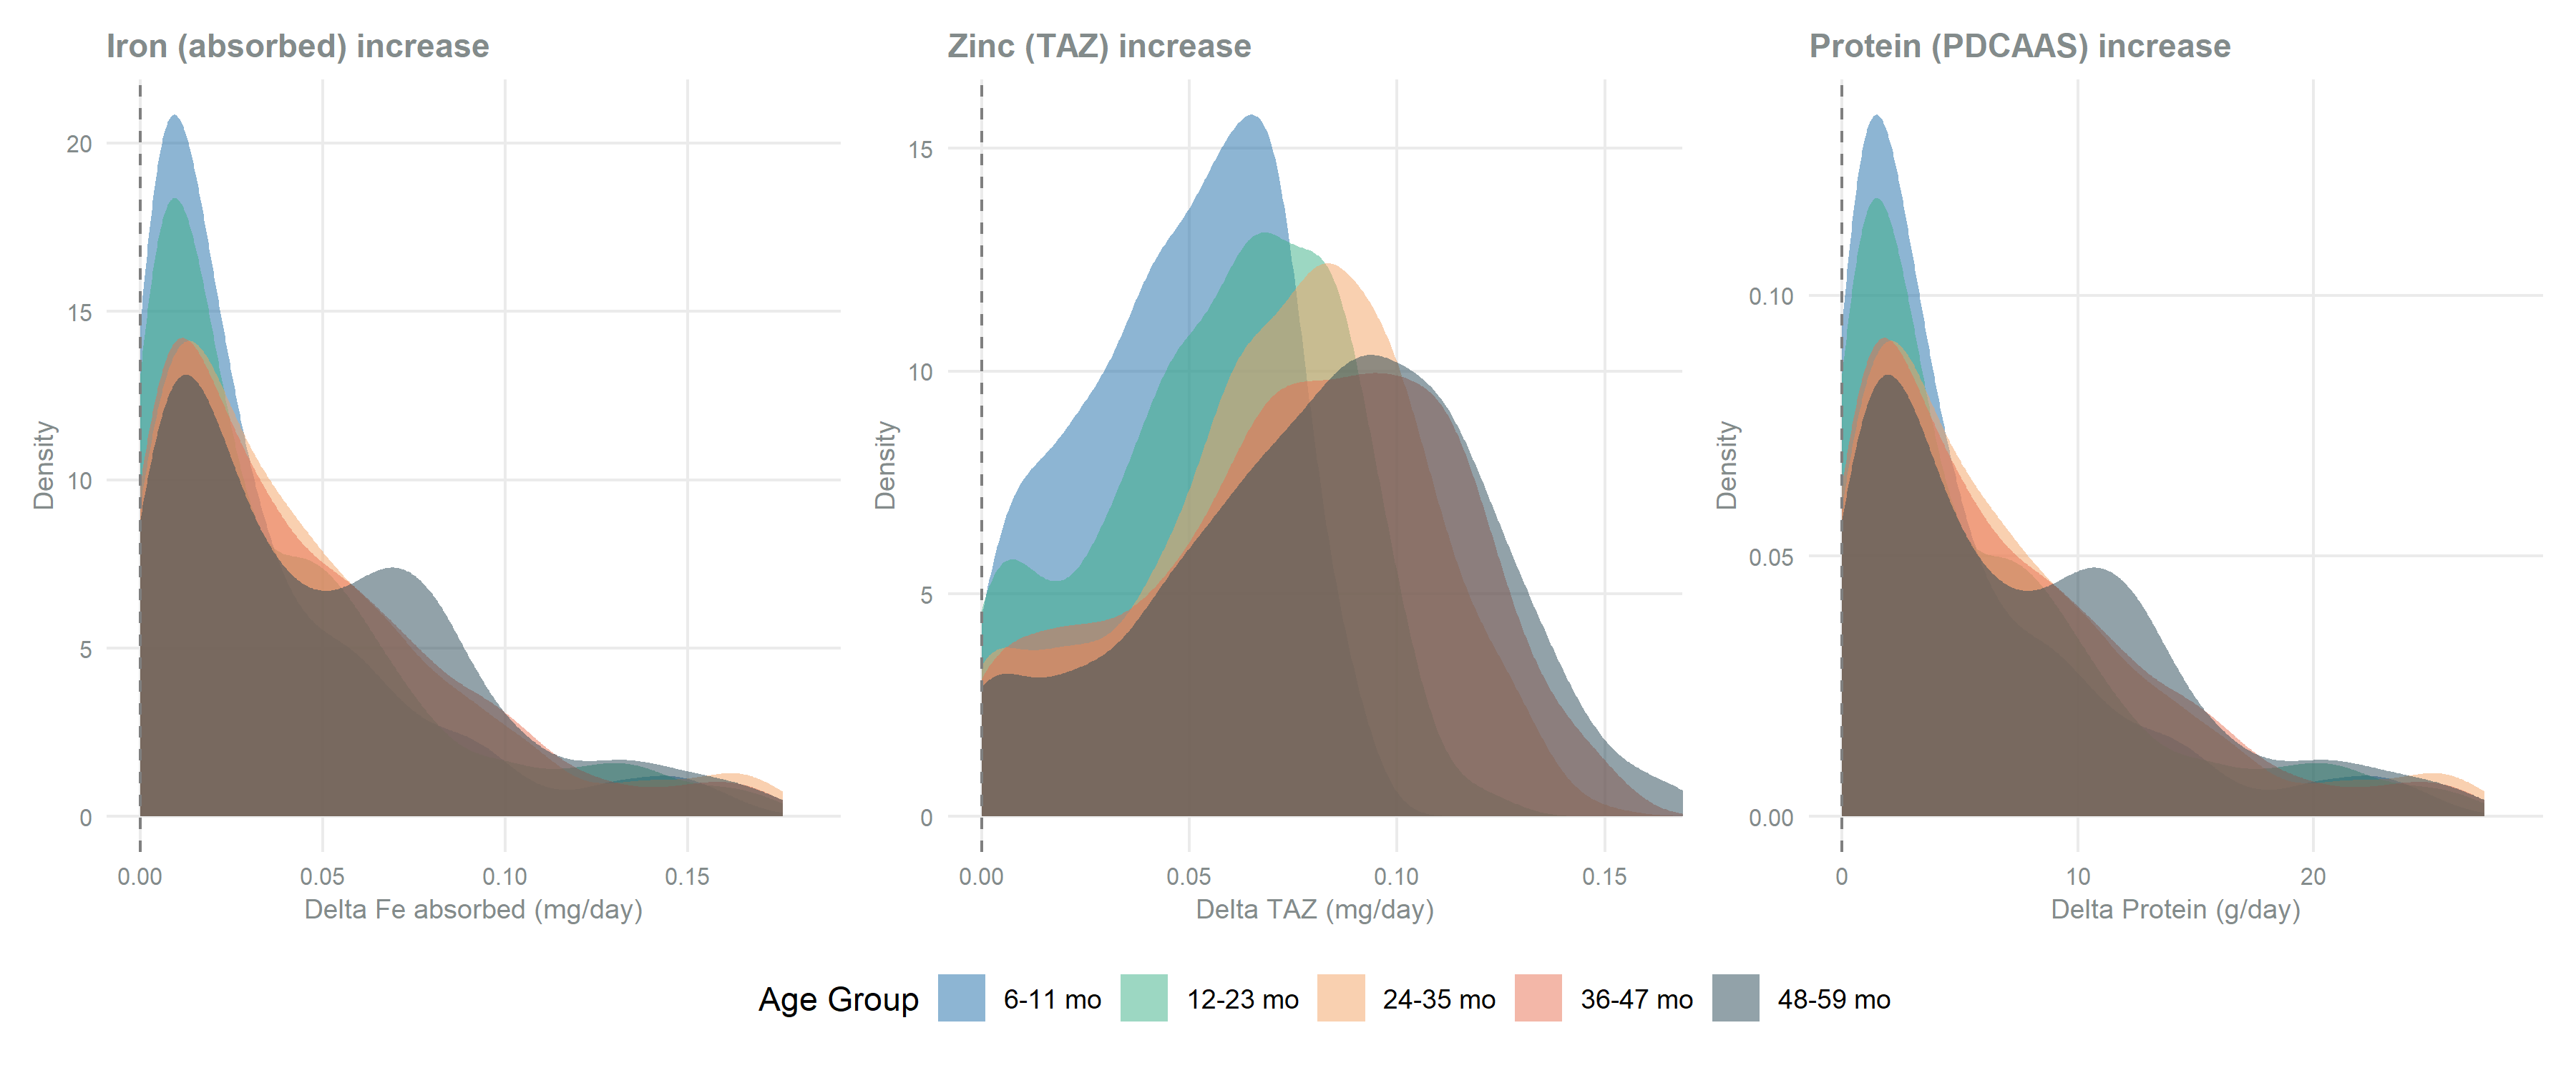
Absorbed Nutrient Increase Distributions
Bioavailability by Age Group (QPM)
| Micronutrient Intake and Bioavailability by Age Group — QPM Intervention | |||||||||||||
| ENCOVI 2023, children 6-59 months (survey-weighted, 100% coverage) | |||||||||||||
| Age Group | N |
Iron (mg/d)
|
Zinc (mg/d)
|
Protein (g/d)
|
|||||||||
|---|---|---|---|---|---|---|---|---|---|---|---|---|---|
| Fe Intake | 95% CI | Fe Absorbed | 95% CI | Zn Intake | 95% CI | TAZ | 95% CI | Zn Abs % | 95% CI | Protein | 95% CI | ||
| 6-11 mo | 421 | 8.31 | [7.64, 8.969] | 0.42 | [0.38, 0.4485] | 5.83 | [5.24, 6.413] | 0.72 | [0.69, 0.7521] | 16.7 | [15.9, 17.54] | 16.15 | [14.62, 17.68] |
| 12-23 mo | 844 | 9.51 | [9.00, 10.014] | 0.48 | [0.45, 0.5007] | 6.52 | [6.09, 6.943] | 0.94 | [0.91, 0.9633] | 19.2 | [18.5, 19.83] | 18.93 | [17.79, 20.08] |
| 24-35 mo | 902 | 11.38 | [10.81, 11.940] | 0.57 | [0.54, 0.5970] | 7.90 | [7.41, 8.381] | 1.18 | [1.15, 1.2089] | 19.8 | [19.1, 20.47] | 22.73 | [21.40, 24.05] |
| 36-47 mo | 865 | 11.58 | [11.10, 12.058] | 0.58 | [0.55, 0.6029] | 7.88 | [7.46, 8.300] | 1.33 | [1.30, 1.3565] | 21.3 | [20.6, 21.95] | 23.00 | [21.86, 24.14] |
| 48-59 mo | 1033 | 12.88 | [12.39, 13.372] | 0.64 | [0.62, 0.6686] | 8.74 | [8.34, 9.150] | 1.49 | [1.46, 1.5188] | 21.4 | [20.7, 22.00] | 25.90 | [24.78, 27.03] |
| N: unweighted sample size. All estimates survey-weighted. | |||||||||||||
| QPM factors: Fe ×1.19, Zn ×1.38, Protein ×1.94 (PDCAAS). Iron: 5% absorption. Zinc: Miller equation. | |||||||||||||
Summary
Key Findings
Chispitas supplementation integration: Departmental Chispitas contributions (Fe and Zn) are added to non-maize intake variables before the bioavailability pipeline, so the Meta-analysis (Gunaratna) pathway baseline includes current micronutrient supplementation policy in Guatemala.
Outlier treatment: Records above the maize energy ceiling (2,500 kcal/day) or above the non-maize Tukey fence are flagged and replaced via k-NN imputation conditioned on the child’s own ENCOVI record. Non-maize protein is screened separately against its own Tukey fence and imputed the same way.
Baseline inadequacy: Nationally, iron reaches 54.2%, zinc 53.6% and protein 56.5%. The ordering varies by age-sex stratum (see Table 8 and Table 10).
QPM intervention: At 100% coverage, protein inadequacy falls furthest, by 19.3 percentage points, followed by zinc at 8.4 and iron at 4.3 (see Table 10). The protein figure follows the PDCAAS change (0.317 → 0.616), with total protein quantity unchanged.
Pre-computed intervention profiles: Both baseline and QPM nutrient indicators are computed at the individual level, so downstream scenario simulation selects children rather than recalculating them.
WarningLimitations
Iron absorption uniformity — A single 5% factor is applied to all children, without modeling individual variation from iron status or dietary enhancers/inhibitors.
Cross-sectional design — Nutrient inadequacy measures current intake and stunting measures cumulative growth history, so the two are observed over different time horizons.
Full substitution assumption — The QPM columns are computed with all maize replaced by biofortified varieties, and partial coverage is applied downstream through binary assignment.
Chispitas adherence estimate — The national adherence factor of 0.719 is derived from SIVESNU 2018 and applied uniformly across departments.
Imputed record dispersion — The k-NN replacements for the 558 flagged records are neighbour averages, so they carry less spread than the valid records they sit among.
Predictor set of the imputation — The six predictors span demographics, geography, socioeconomic position and diet composition, one variable per dimension. Determinants of dietary intake outside those four dimensions are not represented in the matching space, so the replacements reproduce the central tendency of that space rather than the full heterogeneity of intake.
Application
This enriched dataset — containing baseline and QPM nutrient profiles, bioavailability indicators, and inadequacy classifications for the analytical cohort — feeds the QPM stunting impact calculation and the scenario simulation pipeline in Module 6.
References
EFSA Panel on Dietetic Products, Nutrition and Allergies. (2014). Scientific Opinion on Dietary Reference Values for zinc. EFSA Journal, 12(10), 3844. https://doi.org/10.2903/j.efsa.2014.3844
World Health Organization, Food and Agriculture Organization of the United Nations, & United Nations University. (2007). Protein and Amino Acid Requirements in Human Nutrition: Report of a Joint WHO/FAO/UNU Expert Consultation. World Health Organization.