QPM Stunting Impact
Module 5: Meta-analysis
Why Calculate QPM Stunting Impact?
The Meta-analysis (Gunaratna) pathway quantifies the stunting reduction achievable through biofortified maize consumption. Using the 9% height growth velocity increase from Gunaratna et al. (2010) — a meta-analysis of 9 community-based RCTs, of which 7 contributed to the height effect estimate after excluding Mexico (no height data reported) and Nicaragua (statistical outlier) — this module calculates the individual-level height increment attributable to quality protein maize (QPM) for each child based on their baseline HAZ, age, sex, and protein adequacy.
The QPM height increment is modulated by a protein adequacy factor that carries individual-level heterogeneity: children meeting their protein requirement take the full 9% effect, and children far below their requirement take an attenuated one, following a rescaled logistic sigmoid. The modulation follows the mechanism QPM acts through, a higher protein quality (PDCAAS), which needs protein quantity in the diet to reach growth.
Data and Growth Velocity Reference
The framework loads the bioavailability-enriched dataset and WHO Child Growth Standards (0-60 months, daily resolution) plus WHO 2007 Reference (de Onis et al., 2007) (61-71 months, monthly resolution). The combined reference table provides complete coverage for calculating 12-month growth velocity for children aged 6-59 months at baseline (endline ages 18-71 months).
Growth Velocity by Baseline HAZ
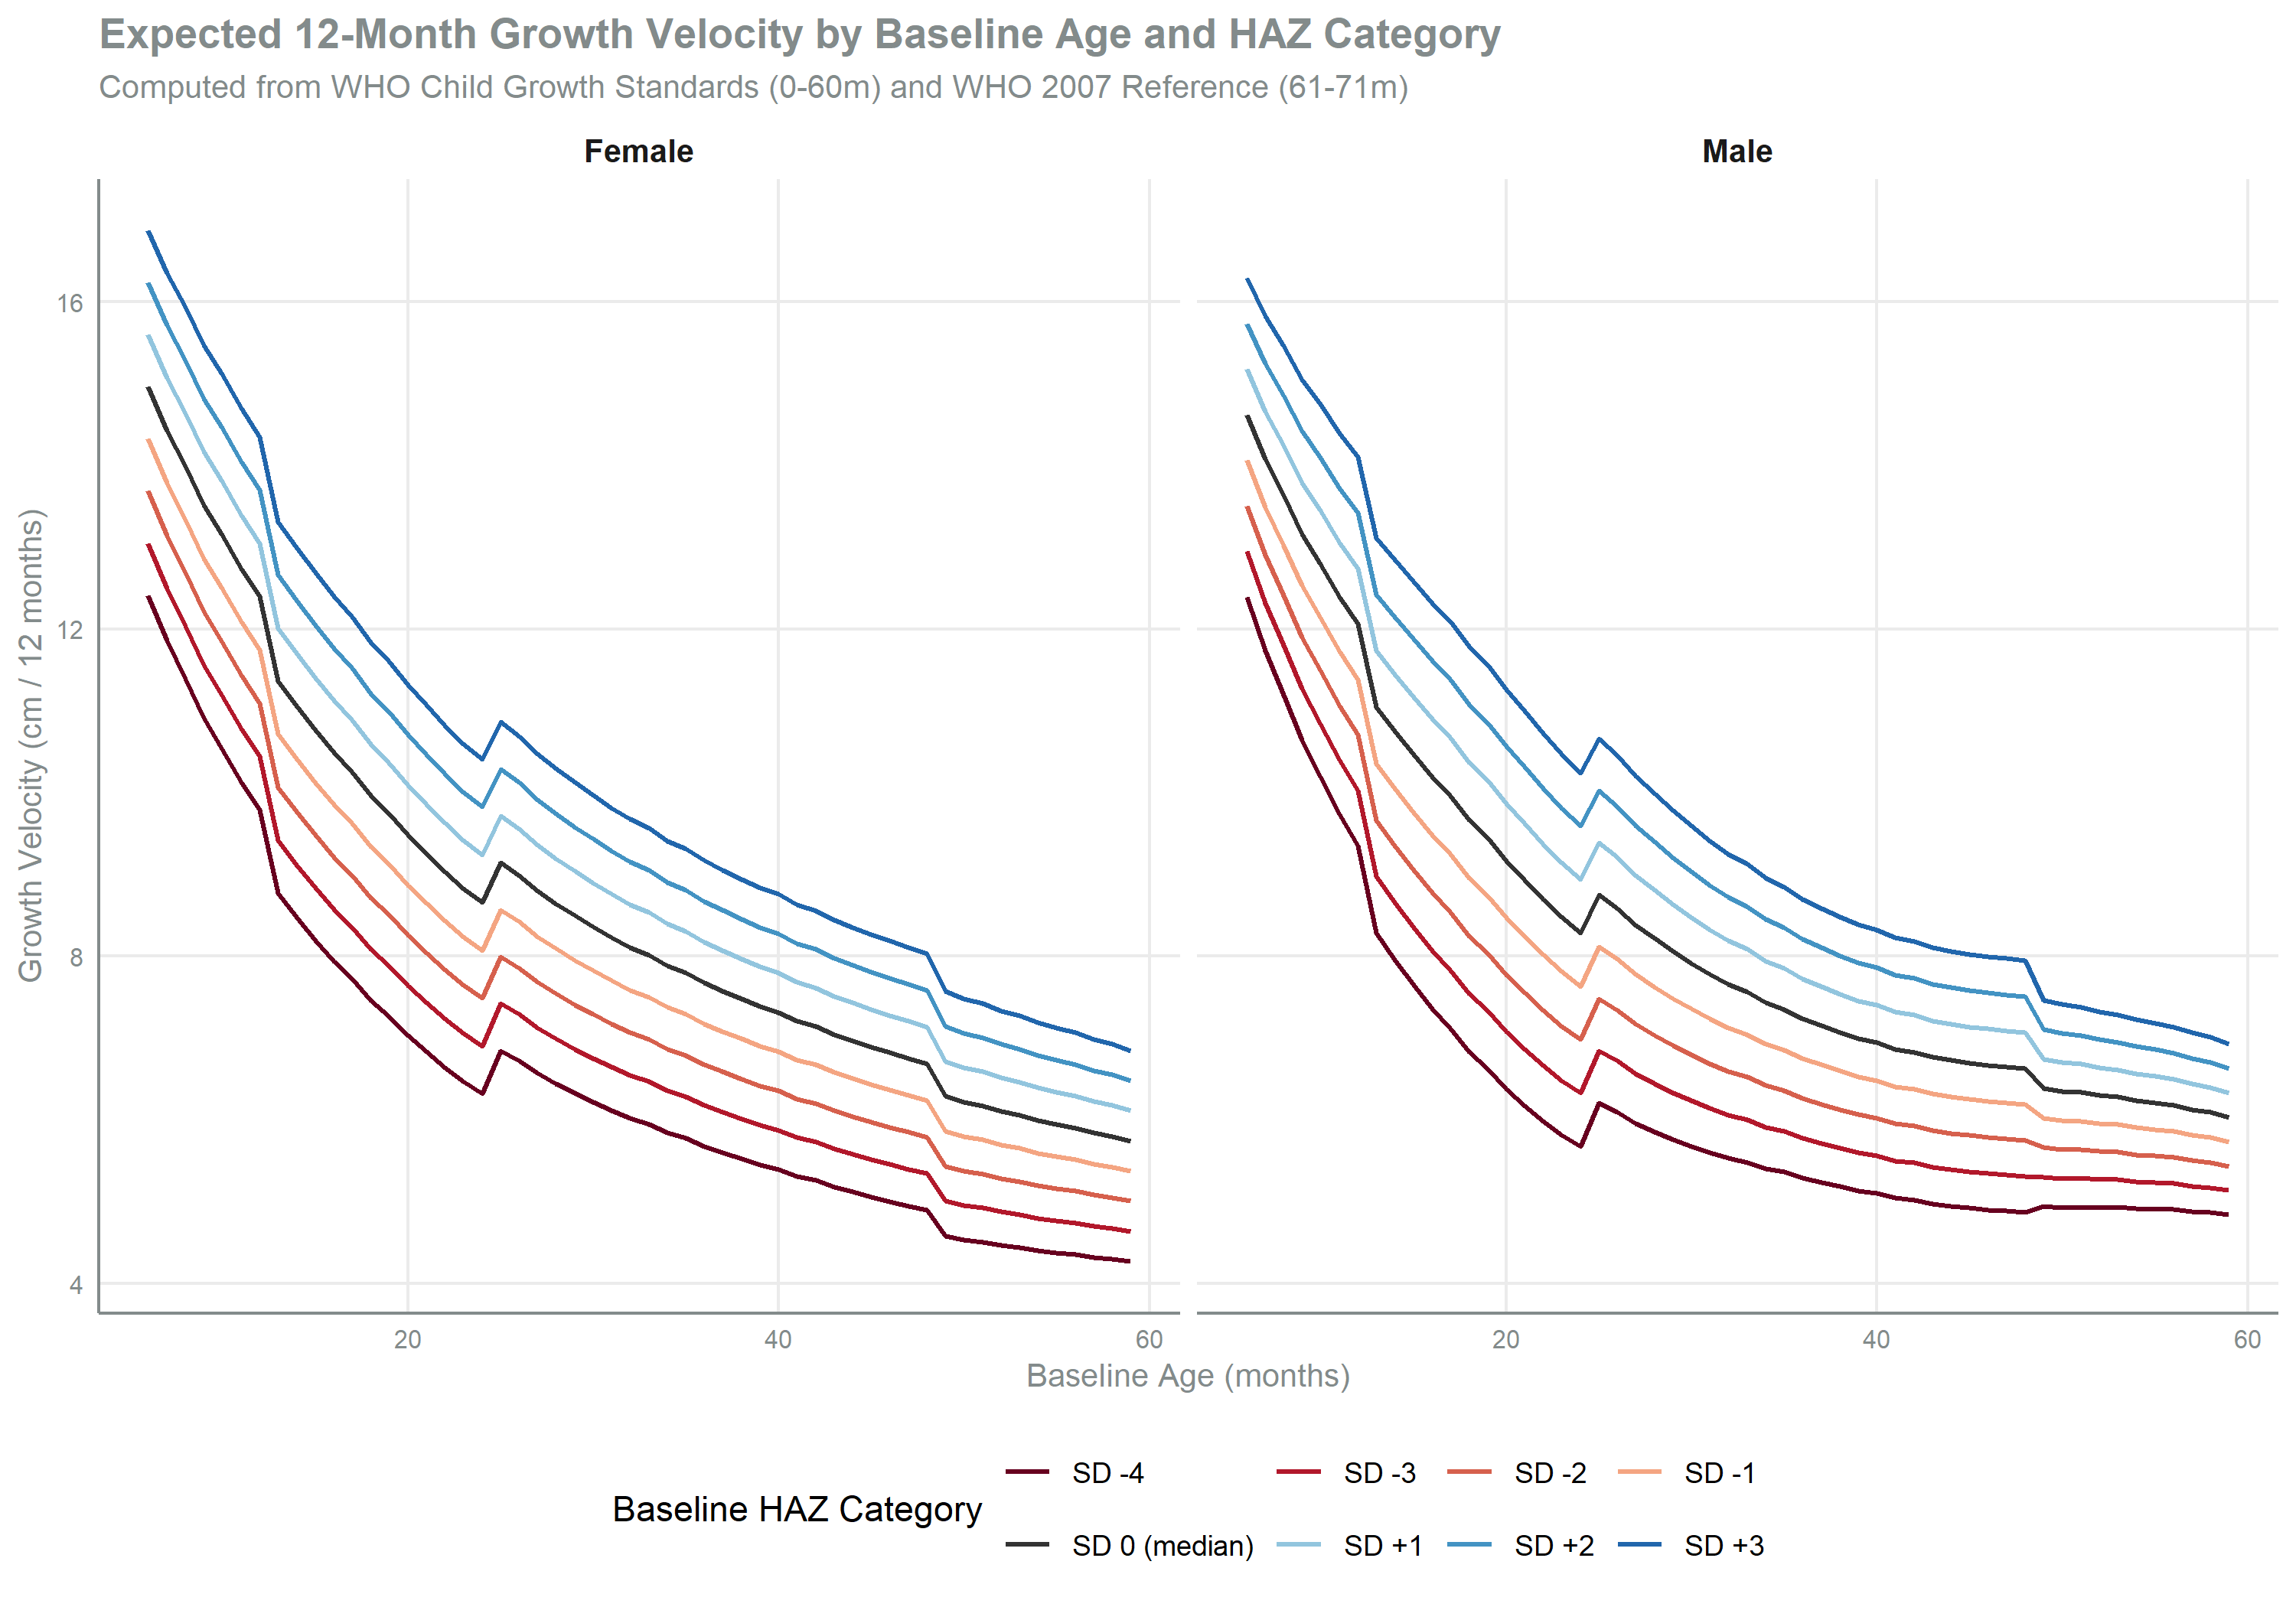
Growth velocity decreases with age in every HAZ category, consistent with the deceleration of linear growth in children under 5. Children with lower baseline HAZ carry lower absolute growth velocities: at 12 months the reference gives 9.6 cm per year at −4 SD against 12.2 cm at the median. The curves are separated across categories, which is the variation the interpolation reads each child’s velocity from.
Meta-Analysis and Modulation Parameters
The effect size from Gunaratna et al. (2010) is a 9% increase in height growth velocity (multiplicative ratio = 1.09; 95% CI: 6-15%, p < 0.0001), derived from a meta-analysis of 7 community-based RCTs (main dataset) in children with mild-to-moderate undernutrition and maize-dependent diets. The intervention is projected over 12 months for the cohort of children aged 6-59 months at baseline.
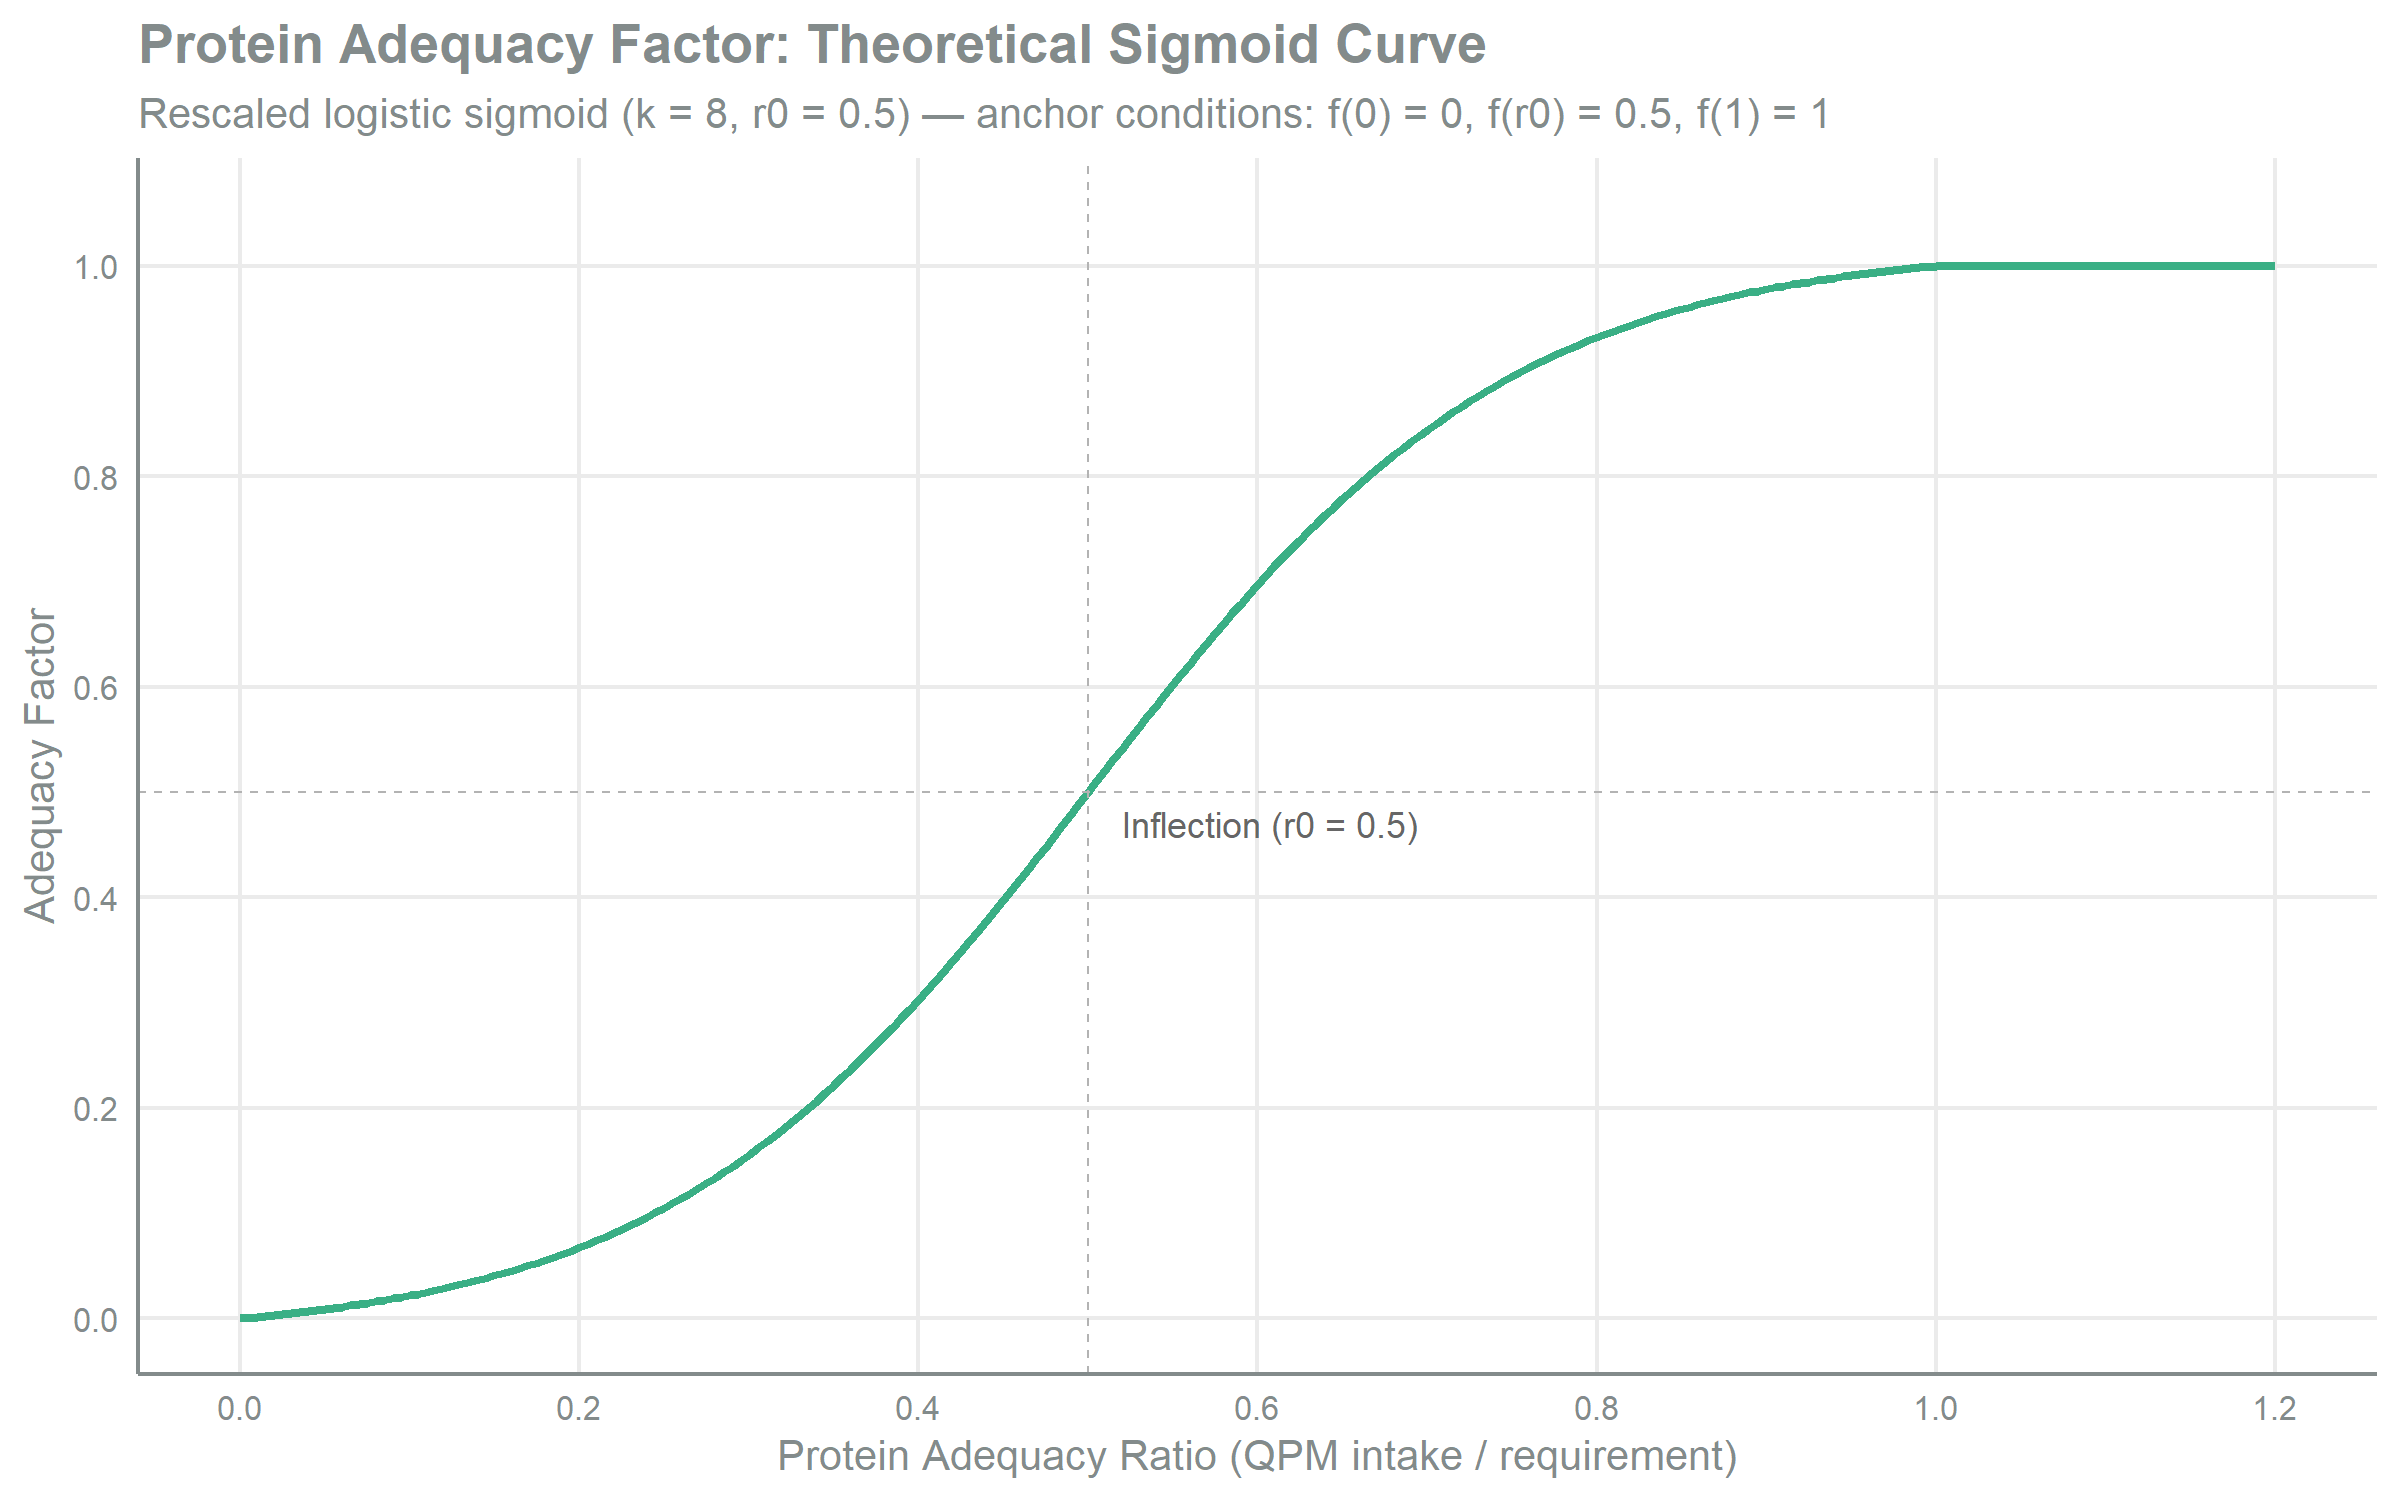
The protein adequacy factor is a rescaled logistic sigmoid with slope parameter k = 8 and inflection point r₀ = 0.5. The biological basis is a dose-response relationship with a homeostatic tolerance zone near full adequacy and accelerated decline below metabolic breakpoints (Scheffler et al., 2021; Gunaratna et al. (2010)).
Growth Velocity Assignment
Interpolation and Validation
For each child, the expected 12-month growth velocity is interpolated linearly between the two adjacent HAZ categories in the WHO reference table. A child with HAZ = -2.3 receives 70% weight from the SD(-2) velocity and 30% from the SD(-3) velocity, avoiding artificial discontinuities.
| 12-Month Growth Velocity Assignment | |||||||
| Interpolated from WHO growth velocity tables by baseline HAZ, age, and sex | |||||||
| Sex | N | Assigned | % Assigned | Mean (cm) | SD (cm) | Min (cm) | Max (cm) |
|---|---|---|---|---|---|---|---|
| 6-11 mo | |||||||
| Hombre | 223 | 223 | 100.0 | 12.10 | 1.10 | 9.73 | 14.88 |
| Mujer | 198 | 198 | 100.0 | 12.48 | 1.08 | 10.39 | 15.04 |
| 12-23 mo | |||||||
| Hombre | 429 | 429 | 100.0 | 8.46 | 1.15 | 6.18 | 12.26 |
| Mujer | 415 | 415 | 100.0 | 8.95 | 1.06 | 6.80 | 11.86 |
| 24-35 mo | |||||||
| Hombre | 472 | 472 | 100.0 | 6.86 | 0.60 | 5.44 | 8.89 |
| Mujer | 430 | 430 | 100.0 | 7.36 | 0.58 | 5.95 | 9.19 |
| 36-47 mo | |||||||
| Hombre | 445 | 445 | 100.0 | 6.00 | 0.42 | 4.97 | 7.17 |
| Mujer | 420 | 420 | 100.0 | 6.23 | 0.48 | 5.12 | 7.66 |
| 48-59 mo | |||||||
| Hombre | 527 | 527 | 100.0 | 5.60 | 0.31 | 4.91 | 6.52 |
| Mujer | 506 | 506 | 100.0 | 5.30 | 0.41 | 4.30 | 6.91 |
| Growth velocity: expected cm of growth in 12 months, interpolated between adjacent HAZ categories. | |||||||
| All children aged 6-59 months receive a velocity assignment. WHO under-5 standards (0-60m) and WHO 2007 reference (61-71m) provide complete endline coverage. | |||||||
NoteComplete Assignment
Each of the 4,065 children in the cohort receives a growth velocity assignment. Mean velocity falls from 12.1 cm per 12 months at 6-11 months to 5.4 cm at 48-59 months (see Table 1), following the deceleration in the reference.
HAZ Clamping Below -4 SD
Children with baseline HAZ below -4 SD receive the growth velocity at the -4 SD boundary. The WHO expanded tables extend coverage to -4 SD, improving coverage for Guatemala’s left-shifted distribution.
| Children with Baseline HAZ Below -4 SD | |||||
| Growth velocity assigned at the -4 SD boundary value (clamped, not extrapolated) | |||||
| Sex | N (with GV) | N Below -4 SD | % Below -4 SD | Mean HAZ (clamped group) | Min HAZ |
|---|---|---|---|---|---|
| 6-11 mo | |||||
| Hombre | 223 | 3 | 1.3 | −4.22 | −4.52 |
| Mujer | 198 | 0 | 0.0 | — | −3.63 |
| 12-23 mo | |||||
| Hombre | 429 | 2 | 0.5 | −4.21 | −4.38 |
| Mujer | 415 | 3 | 0.7 | −4.04 | −4.08 |
| 24-35 mo | |||||
| Hombre | 472 | 6 | 1.3 | −4.26 | −4.53 |
| Mujer | 430 | 5 | 1.2 | −4.54 | −5.24 |
| 36-47 mo | |||||
| Hombre | 445 | 4 | 0.9 | −4.19 | −4.29 |
| Mujer | 420 | 3 | 0.7 | −4.05 | −4.10 |
| 48-59 mo | |||||
| Hombre | 527 | 4 | 0.8 | −4.21 | −4.45 |
| Mujer | 506 | 6 | 1.2 | −4.42 | −4.81 |
| These children receive the same growth velocity as a child at HAZ = -4.0. | |||||
| WHO expanded tables extend coverage to -4 SD. Values beyond this boundary are conservatively assigned the -4 SD velocity. | |||||
NoteBoundary Treatment
0.9% of children, 36 in total, have a baseline HAZ below -4 SD, with the lowest observed at -5.24. They take the velocity at the -4 SD boundary, which the reference tables cover, and the QPM increment for these children is computed on that value.
Protein Adequacy Factor
Rescaled Logistic Sigmoid
The protein adequacy factor modulates the QPM effect based on the child’s protein adequacy ratio under the intervention. The function satisfies three anchor conditions: f(0) = 0, f(r₀) = 0.5, and f(1) = 1.
\[f(r) = \frac{\sigma(r) - \sigma(0)}{\sigma(1) - \sigma(0)}, \quad \sigma(r) = \frac{1}{1 + e^{-k(r - r_0)}}\]
Where k = 8 (slope) and r₀ = 0.5 (inflection point). Near full adequacy, between ratios 0.8 and 1.0, the factor stays close to 1, which is the homeostatic tolerance zone. Below a ratio of 0.4 it declines sharply, at the metabolic breakpoints where protein intake constrains growth.
| Protein Adequacy Factor by Age Group | |||||
| Mean values for children with assigned growth velocity | |||||
| Age Group | N | Mean | SD | Median | Min |
|---|---|---|---|---|---|
| 48-59 mo | 1033 | 0.874 | 0.269 | 1.000 | 0.000 |
| 6-11 mo | 421 | 0.792 | 0.312 | 0.988 | 0.002 |
| 24-35 mo | 902 | 0.908 | 0.231 | 1.000 | 0.001 |
| 36-47 mo | 865 | 0.845 | 0.284 | 1.000 | 0.004 |
| 12-23 mo | 844 | 0.858 | 0.276 | 1.000 | 0.000 |
| Adequacy factor: rescaled sigmoid (k=8, r0=0.5) applied to QPM protein adequacy ratio. | |||||
ImportantAdequacy Factor Distribution
The mean factor ranges from 0.777 at 6-11 months, the lowest of the five bands, to 0.895 at 24-35 months (see Table 3). Medians sit at 1.000 in four bands and 0.984 at 6-11 months, so most children take the unattenuated effect and the sigmoid acts on the lower tail of the protein adequacy distribution. The minimum is 0 in every band.
QPM Height Increment and Stunting Reclassification
The QPM-attributable height increment combines three components:
\[\Delta h_{QPM} = v_{12m} \times E \times A\]
Where \(v_{12m}\) is the 12-month growth velocity, \(E\) = 0.09 (meta-analysis effect size), and \(A\) is the protein adequacy factor. The final height under QPM is \(h_{QPM} = h_{baseline} + v_{12m} + \Delta h_{QPM}\), and HAZ is recalculated using WHO LMS parameters at the endline age.
Results
Height Increment by Age Group
| QPM-Attributable Height Increment by Age Group | |||||||
| ENCOVI 2023, children 6-59 months — 100% coverage scenario (survey-weighted) | |||||||
| Age Group | N | Growth Vel. (cm/12m) | 95% CI | QPM Increment (cm) | 95% CI | Delta HAZ | 95% CI |
|---|---|---|---|---|---|---|---|
| 6-11 mo | 421 | 12.31 | [12.17, 12.448] | 0.875 | [0.831, 0.9184] | 0.2990 | [0.2839, 0.31413] |
| 12-23 mo | 844 | 8.71 | [8.61, 8.818] | 0.679 | [0.657, 0.7003] | 0.1998 | [0.1928, 0.20672] |
| 24-35 mo | 902 | 7.12 | [7.06, 7.180] | 0.579 | [0.564, 0.5932] | 0.1457 | [0.1419, 0.14940] |
| 36-47 mo | 865 | 6.13 | [6.09, 6.171] | 0.466 | [0.452, 0.4801] | 0.1048 | [0.1016, 0.10794] |
| 48-59 mo | 1033 | 5.44 | [5.41, 5.478] | 0.433 | [0.422, 0.4428] | 0.0897 | [0.0876, 0.09189] |
| Effect size: 9% (Gunaratna et al., 2010). Modulation: sigmoid protein adequacy factor (k=8, r0=0.5). | |||||||
| N: unweighted sample size. All estimates survey-weighted. | |||||||
NoteAge-Dependent Impact
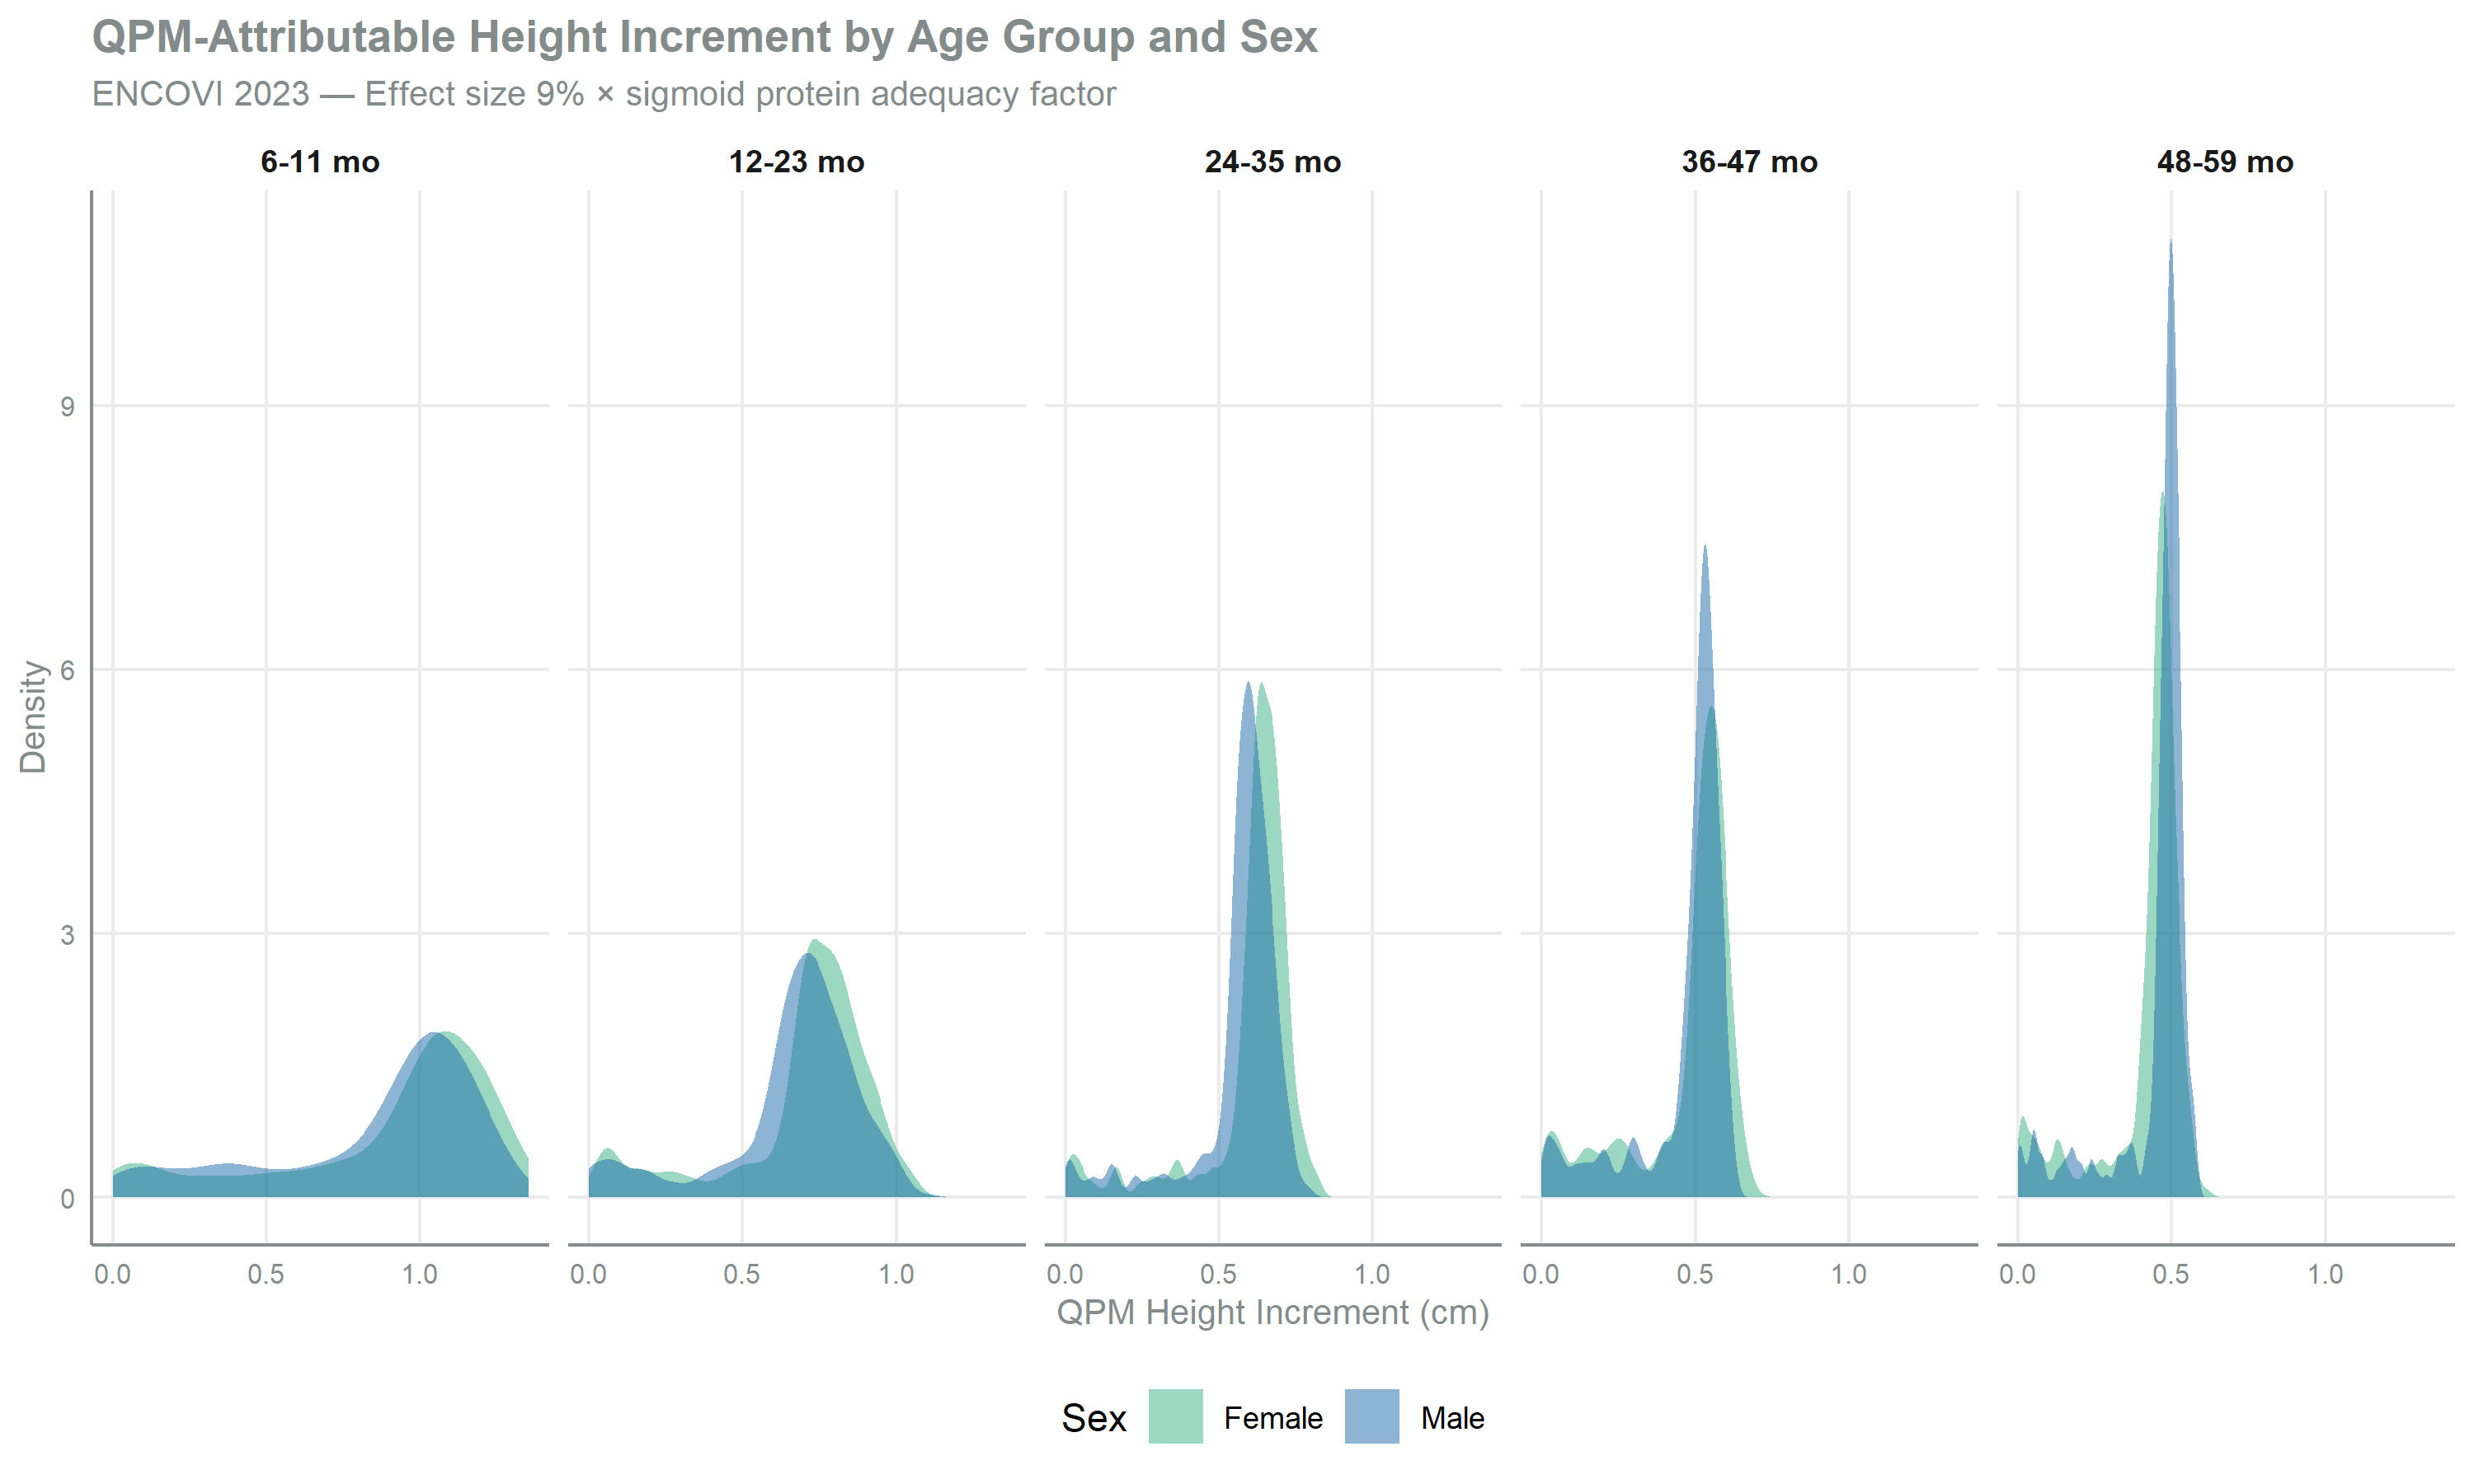
The QPM height increment falls from 0.854 cm at 6-11 months to 0.424 cm at 48-59 months (see Table 4), which follows the growth velocity it is a proportion of. The corresponding change in HAZ moves in the same direction, from 0.292 to 0.088.
National Stunting Impact
| Stunting Impact: Baseline vs. QPM Intervention (100% Coverage) | ||
| ENCOVI 2023, children 6-59 months (survey-weighted) | ||
| N | Metric | Value |
|---|---|---|
| 4065 | Stunting baseline (%) | 48.58 |
| 4065 | Stunting with QPM (%) | 42.75 |
| 4065 | Stunting reduction (pp) | −5.82 |
| 4065 | Mean HAZ baseline | −1.98 |
| 4065 | Mean HAZ with QPM | −1.82 |
| 4065 | Mean delta HAZ (QPM effect) | 0.15 |
| Stunting: HAZ < -2 (WHO). QPM effect: 9% growth velocity increase (Gunaratna, 2010). | ||
| N: unweighted sample size. All estimates survey-weighted. | ||
ImportantStunting Reduction
At 100% QPM coverage the modelled national stunting prevalence moves from 48.6% to 42.8%, a reduction of 5.8 percentage points, and mean HAZ from -1.976 to -1.825, a change of 0.151. This is the upper bound of the model, computed with all maize replaced by biofortified varieties.
Departmental Impact
| Stunting Impact by Department — QPM Intervention (100% Coverage) | |||||||
| ENCOVI 2023 (survey-weighted) | |||||||
| Department | N | Baseline (%) | QPM (%) | HAZ Baseline | HAZ QPM | Delta HAZ | Change (pp) |
|---|---|---|---|---|---|---|---|
| Chiquimula | 136 | 55.6 | 39.9 | −1.812 | −1.653 | 0.160 | −15.7 |
| Sololá | 146 | 65.6 | 54.8 | −2.157 | −2.017 | 0.140 | −10.8 |
| Quiché | 274 | 68.7 | 59.9 | −2.222 | −2.079 | 0.143 | −8.8 |
| Alta Verapaz | 247 | 50.0 | 41.5 | −1.973 | −1.827 | 0.146 | −8.5 |
| Sacatepéquez | 168 | 42.4 | 34.7 | −1.947 | −1.801 | 0.147 | −7.7 |
| Suchitepéquez | 223 | 39.6 | 31.9 | −1.864 | −1.707 | 0.157 | −7.7 |
| Quetzaltenango | 174 | 48.8 | 41.3 | −1.923 | −1.776 | 0.147 | −7.5 |
| Baja Verapaz | 203 | 50.2 | 42.9 | −1.910 | −1.761 | 0.149 | −7.3 |
| Jalapa | 196 | 53.8 | 47.1 | −1.937 | −1.787 | 0.150 | −6.7 |
| San Marcos | 204 | 54.8 | 48.5 | −2.116 | −1.968 | 0.147 | −6.3 |
| Totonicapán | 194 | 70.0 | 63.8 | −2.394 | −2.236 | 0.158 | −6.2 |
| Izabal | 191 | 26.4 | 20.8 | −1.478 | −1.325 | 0.153 | −5.6 |
| Huehuetenango | 207 | 67.7 | 62.5 | −2.299 | −2.144 | 0.156 | −5.2 |
| Zacapa | 151 | 40.0 | 34.9 | −1.705 | −1.561 | 0.144 | −5.1 |
| Petén | 200 | 36.1 | 31.7 | −1.767 | −1.613 | 0.154 | −4.4 |
| Retalhuleu | 138 | 34.2 | 30.2 | −1.845 | −1.692 | 0.153 | −4.0 |
| Santa Rosa | 117 | 33.6 | 30.0 | −1.864 | −1.712 | 0.152 | −3.6 |
| Escuintla | 208 | 26.9 | 23.9 | −1.791 | −1.649 | 0.142 | −3.0 |
| El Progreso | 138 | 29.1 | 26.8 | −1.825 | −1.674 | 0.150 | −2.3 |
| Chimaltenango | 204 | 56.5 | 54.8 | −2.252 | −2.113 | 0.139 | −1.7 |
| Jutiapa | 173 | 35.7 | 34.1 | −1.456 | −1.306 | 0.149 | −1.6 |
| Guatemala | 173 | 25.3 | 24.1 | −1.726 | −1.559 | 0.167 | −1.2 |
| QPM effect: 9% growth velocity increase × sigmoid protein adequacy factor. | |||||||
| N: unweighted sample size. All estimates survey-weighted. | |||||||
The modelled reduction ranges from 15.7 percentage points in Chiquimula to 1.2 in Guatemala (see Table 6). It is negatively correlated with baseline prevalence, at -0.54, so departments starting higher tend to move further, though the relation is loose: Totonicapán carries the highest baseline at 70.0% and a reduction of 5.8 pp, while Chiquimula starts at 55.6% and reaches 14.5. The mean HAZ change is close to uniform across departments, between 0.128 and 0.167, so what varies is how many children the change carries across the −2 threshold rather than the size of the change itself.
QPM Height Increment Distribution
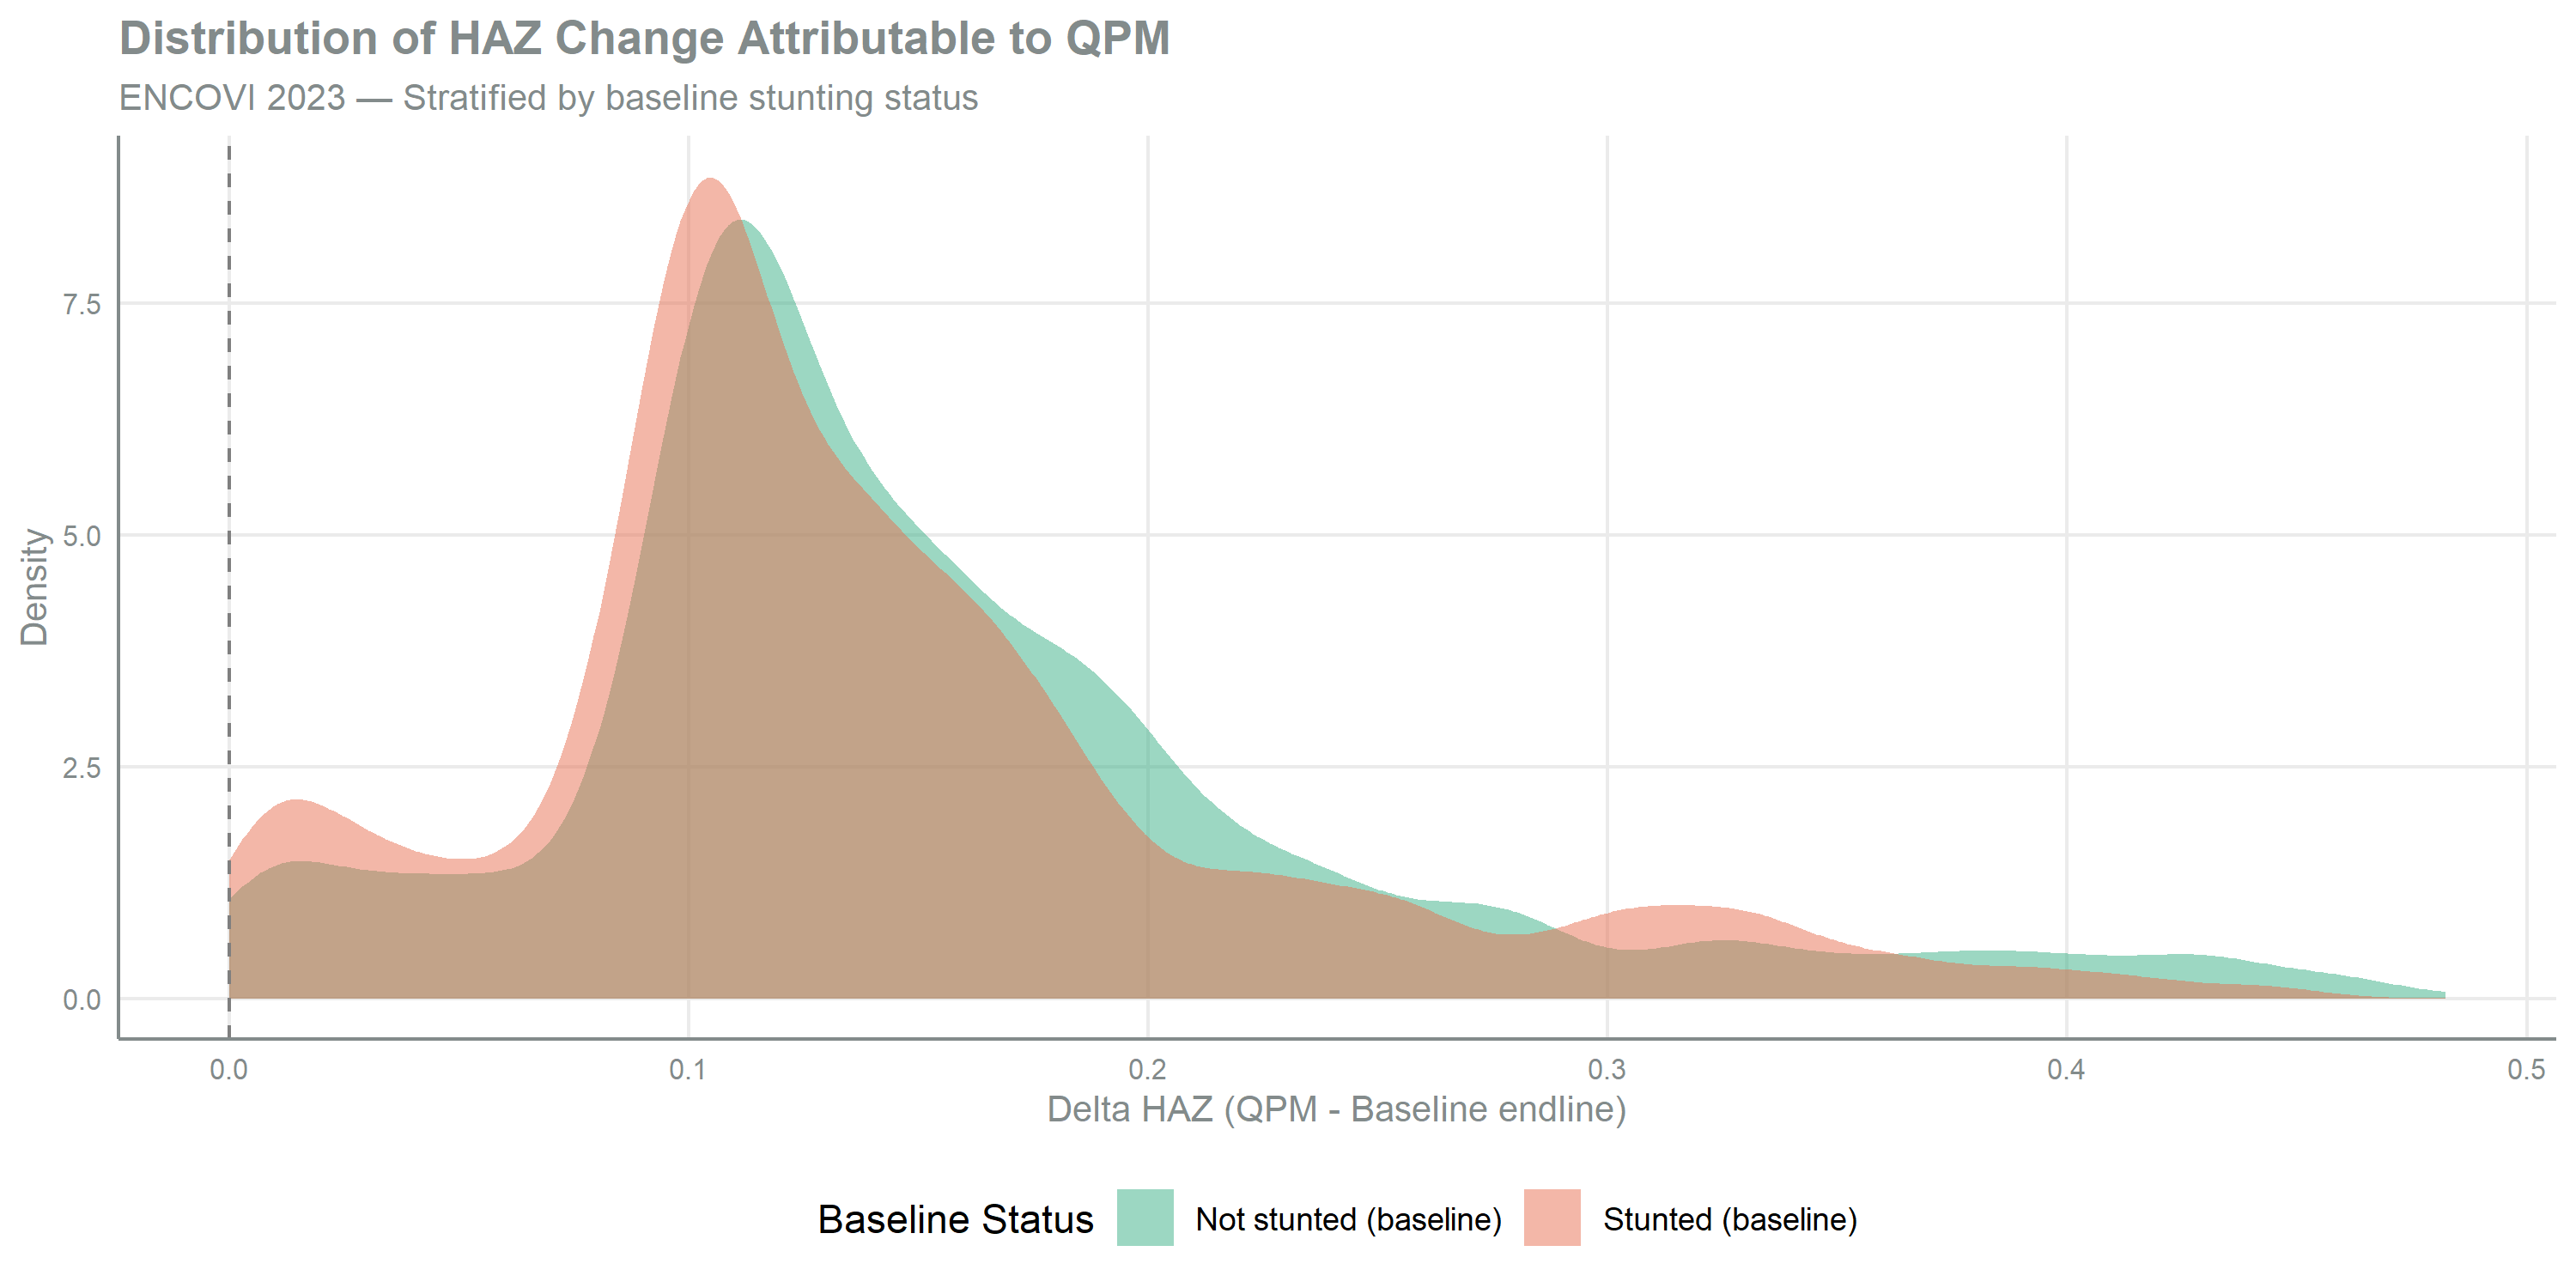
The two groups receive HAZ changes of similar magnitude, with a mean of 0.155 among children not stunted at baseline against 0.143 among those who are. The ordering follows the growth velocity reference: a lower baseline HAZ carries a lower expected 12-month velocity, and the QPM increment is a fixed proportion of that velocity. The bimodal structure corresponds to the protein adequacy factor, which separates children near full adequacy from those the sigmoid attenuates.
Summary
Key Findings
Growth velocity: All 4,065 children receive WHO-based growth velocity assignments interpolated by baseline HAZ, age, and sex. Only 0.9% require clamping below -4 SD.
Protein adequacy modulation: The mean adequacy factor ranges from 0.777 to 0.895 across age groups (see Table 3), with medians at or just below 1.0, so the sigmoid acts on the lower tail.
National impact: At 100% coverage, modelled stunting prevalence moves from 48.6% to 42.8% and mean HAZ by 0.151 (see Table 5).
Departmental variation: The reduction ranges from 1.2 to 15.7 percentage points (see Table 6), while the mean HAZ change stays between 0.128 and 0.167, so the spread comes from how many children each department holds near the -2 threshold.
WarningLimitations
Effect size baseline and modulation — The 9% growth velocity increase from Gunaratna et al. (2010) is applied as the baseline effect, with individual modulation through each child’s protein adequacy ratio under the intervention (sigmoid factor described in the protein adequacy section above). Children meeting their protein requirement take close to the full 9% effect and children far below it take an attenuated one. The meta-analysis confidence interval of 6-15% marks heterogeneity across populations that this single mechanism does not represent.
Cross-sectional to longitudinal — Each child is projected forward 12 months with their current characteristics held fixed.
Protein as sole modulator — Protein adequacy is the only quantity that modulates the QPM effect; energy, micronutrients and infection burden do not enter the modulation.
Age range extension — The Gunaratna meta-analysis is calibrated primarily on children 6-24 months, and the extension to 25-59 months applies the protein quality mechanism across the full 6-59 month range.
Boundary clamping — The 36 children below -4 SD take the velocity at that boundary, which sets a floor on the increment assigned to the most affected children.
Application
This dataset — containing baseline and QPM stunting profiles for the analytical cohort — is the primary input for the scenario simulation pipeline (Module 6), which combines the individual-level QPM impact with production coverage scenarios to estimate population-level stunting reduction under different adoption levels.
References
de Onis, M., Onyango, A. W., Borghi, E., Siyam, A., Nishida, C., & Siekmann, J. (2007). Development of a WHO growth reference for school-aged children and adolescents. Bulletin of the World Health Organization, 85(9), 660–667. https://doi.org/10.2471/BLT.07.043497
Gunaratna, N. S., Groote, H. D., Nestel, P., Pixley, K. V., & McCabe, G. P. (2010). A meta-analysis of community-based studies on quality protein maize. Food Policy, 35(3), 202–210. https://doi.org/10.1016/j.foodpol.2009.11.003