Calculating Micronutrient Bioavailability
Module 4: Covariate Prediction
Overview
Not all nutrients consumed are absorbed. Iron and zinc — the micronutrients most relevant to stunting — have absorption rates that vary dramatically based on dietary composition and physiological factors. A child consuming 10 mg of iron from a plant-based diet may absorb only 0.5 mg, while the same amount from meat could yield 2-3 mg of absorbed iron.
This module converts dietary intake estimates into bioavailable nutrients — the amounts actually absorbed and available for physiological use. This transformation is essential for comparing intake against requirements and modeling nutritional adequacy.
We apply two established methodologies:
- Zinc: Miller equation — a saturable absorption model that accounts for age and total zinc intake (Miller et al., 2015).
- Iron: Uniform 5% absorption factor — based on the predominantly plant-based dietary patterns observed in this population (L. Allen et al., 2006).
Data and Parameters
Integrated Dataset
We use the SIVESNU dataset with Chispitas supplementation already integrated. Total zinc and iron intake therefore includes both dietary sources and micronutrient powder contributions.
Miller Equation Parameters
The Miller equation estimates Total Absorbed Zinc (TAZ) as a saturable function of age and total dietary zinc (TDZ). Younger children have lower absorption capacity, which increases with age (Miller et al., 2015).
\[TAZ = 0.5 \times \left( K_T + A \cdot Age^E + TDZ - \sqrt{(K_T + A \cdot Age^E + TDZ)^2 - 4 \cdot (A \cdot Age^E) \cdot TDZ} \right)\]
Where:
- \(TAZ\) = Total Absorbed Zinc (mg/day).
- \(TDZ\) = Total Daily Zinc from all sources (mg/day).
- \(Age\) = Age in months.
- \(K_T\) = 2.42 (saturation constant).
- \(A\) = 0.633 (age coefficient).
- \(E\) = 0.311 (age exponent).
NoteEquation Applicability
The Miller equation was derived from studies including micronutrient powder trials, making it appropriate for estimating absorption from combined diet + Chispitas intake.
Iron Bioavailability Decision
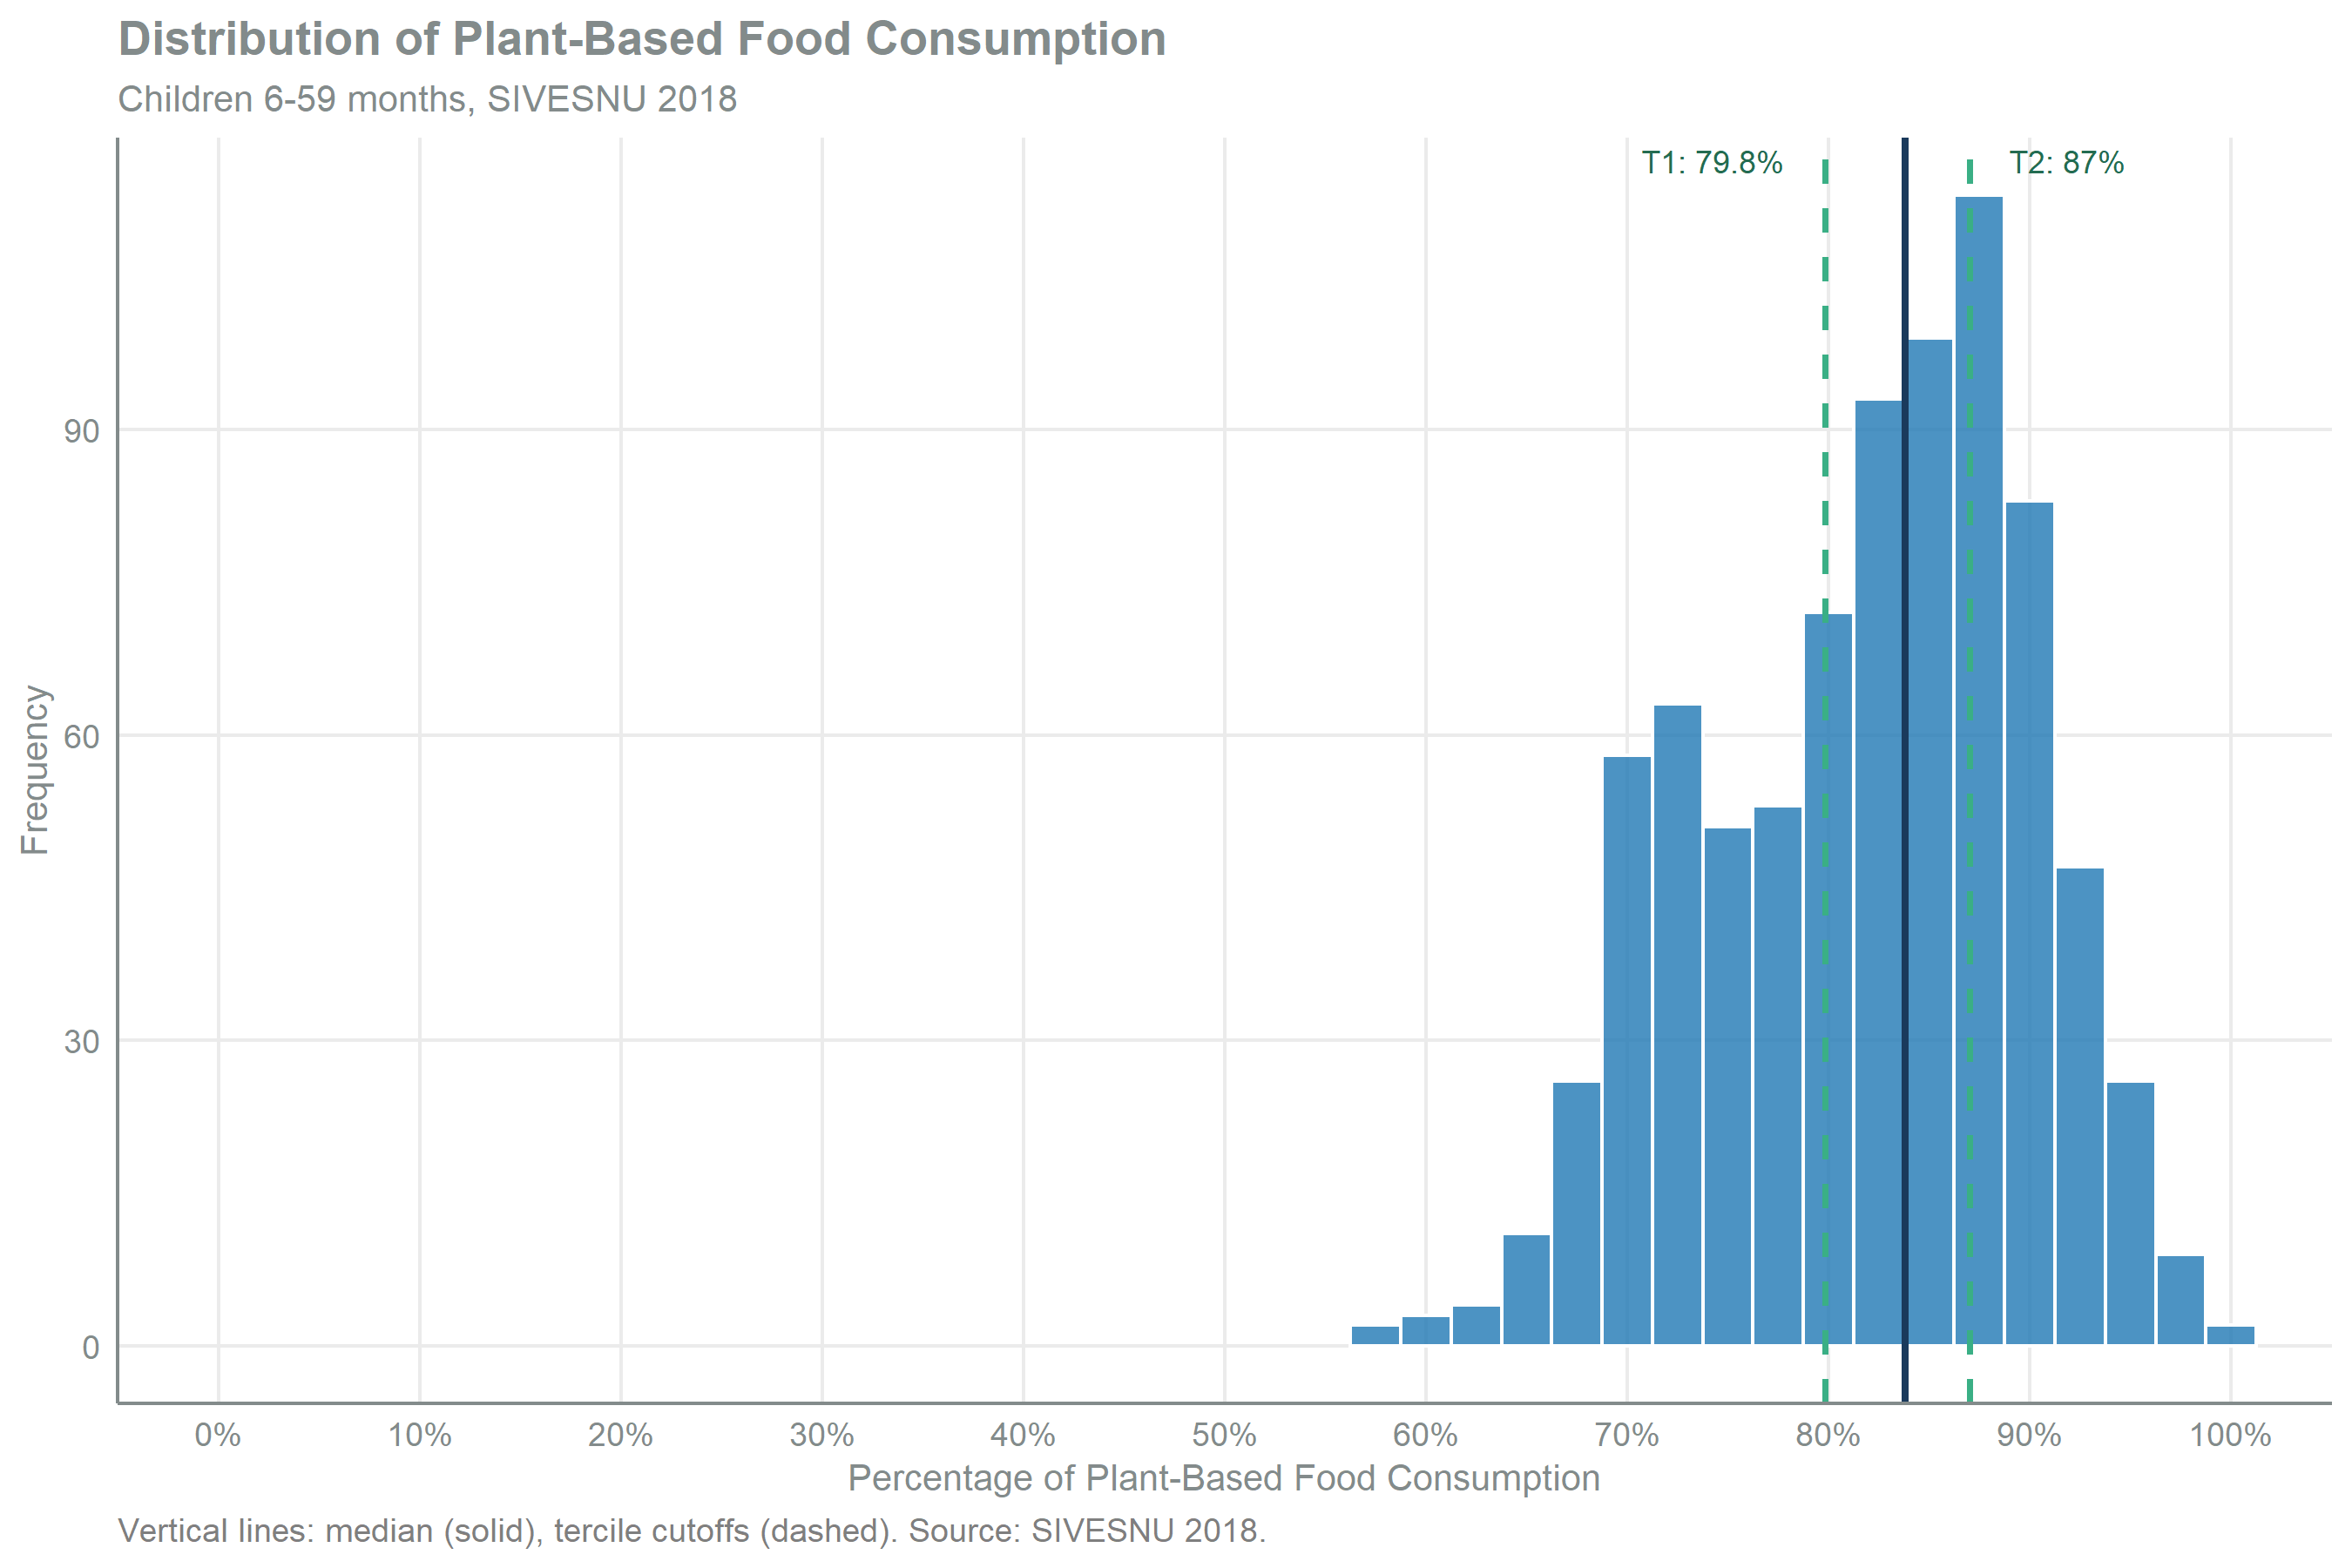
Iron absorption varies dramatically with dietary composition — from ~5% in plant-based diets (high phytate inhibition) to ~15-25% in mixed diets with animal-source foods. Rather than applying individual-level adjustments, we first characterize the population’s dietary patterns.
Dietary Composition Analysis
| Plant-Based Food Percentage Distribution | ||
| Children 6-59 months, SIVESNU 20181 | ||
| Statistic |
Survey-Weighted Estimates
|
|
|---|---|---|
| Value | Interpretation | |
| Mean (± SD) | 82.5% (± 8.0%) | Population average plant-food consumption |
| Median [Q25, Q75] | 83.8% [76.7%, 88.3%] | Central tendency and spread |
| IQR | 11.6% | Interquartile range |
| Tercile 1 cutoff (33.3%) | 79.8% | Lower third of population below this threshold |
| Tercile 2 cutoff (66.7%) | 87.0% | Upper third of population above this threshold |
| 1 Survey weights applied (pesonino). Tercile cutoffs based on the plant-based diet classification of Allen et al. (2006). | ||
| Source: SIVESNU 2018. SD estimated from unweighted data. | ||
Important 1: Methodological Decision: Iron Absorption Rate
Finding: A large majority of children have diets with high plant-based food consumption (see Table 1). Even the lower tercile cutoff falls within the “very high phytate” category. The population distribution of the plant-based diet percentage is also documented in Diet Composition.
Decision: We apply a uniform 5% iron absorption rate, appropriate for the unrefined, high-phytate diets characteristic of this population (L. Allen et al., 2006). Combined with the harmonized average requirement (H-AR) for iron (L. H. Allen et al., 2020), this yields an absorbed iron requirement of 0.5 mg/day.
Absorbed iron requirement: With 5% absorption and 10 mg/day recommended intake, the absorbed iron requirement is 0.5 mg/day.
Validation
Zinc Absorption by Age
The Miller equation produces age-dependent absorption rates. Younger children (6-11 months) show lower fractional absorption than older children (48-59 months), which is consistent with developing intestinal absorption capacity.
| Zinc Absorption by Age Group | |||||||
| Miller equation results for children 6-59 months | |||||||
| Age Group | N |
Zinc Intake (mg/d)
|
Absorbed Zinc (mg/d)
|
Fractional (%)
|
|||
|---|---|---|---|---|---|---|---|
| Zn Intake | 95% CI | TAZ | 95% CI | Absorption | 95% CI | ||
| 6-11 mo | 79 | 3.77 | [3.00, 4.531] | 0.57 | [0.49, 0.6496] | 21.2 | [19.4, 23.12] |
| 12-23 mo | 173 | 5.07 | [4.31, 5.829] | 0.84 | [0.78, 0.8990] | 22.3 | [20.8, 23.79] |
| 24-35 mo | 177 | 5.80 | [4.83, 6.767] | 1.04 | [0.95, 1.1259] | 23.7 | [21.7, 25.69] |
| 36-47 mo | 185 | 7.20 | [6.08, 8.327] | 1.20 | [1.13, 1.2825] | 24.2 | [22.6, 25.91] |
| 48-59 mo | 201 | 7.63 | [6.43, 8.834] | 1.33 | [1.25, 1.4041] | 25.0 | [23.3, 26.74] |
| TAZ = Total Absorbed Zinc. Absorption increases with age per Miller equation. | |||||||
Iron Absorption Summary
| Iron Intake and Absorption | ||||||
| Children 6-59 months, uniform 5% absorption factor | ||||||
| N |
Iron Intake (mg/d)
|
Absorbed Iron (mg/d)
|
Methodology
|
|||
|---|---|---|---|---|---|---|
| Mean Intake | 95% CI | Mean Absorbed | 95% CI | Absorption Factor | Requirement (absorbed) | |
| 815 | 10.32 | [9.49, 11.16] | 0.52 | [0.47, 0.5579] | 5% (low absorption) | 0.5 mg/day |
| Absorption factor based on Allen et al. (2006) classification of diets by iron bioavailability; absorbed requirement based on Allen et al. (2020) H-AR. | ||||||
Combined Bioavailability Summary
| Micronutrient Bioavailability Summary | ||
| Survey-weighted estimates for children 6-59 months | ||
| Metric | Zinc | Iron |
|---|---|---|
| Total Intake (mg/d) | 6.20 | 10.32 |
| Absorbed (mg/d) | 1.06 | 0.52 |
| Absorption Rate (%) | 23.60 | 5.00 |
| Zinc: Miller equation (age-dependent). Iron: Assumed uniform 5% absorption based on dietary patterns | ||
Summary
Key Results
| Micronutrient | Total Intake | Absorbed | Absorption Rate |
|---|---|---|---|
| Zinc | 6.20 mg/d | 1.06 mg/d | 23.6% (age-dependent) |
| Iron | 10.32 mg/d | 0.52 mg/d | 5.0% (uniform) |
Methodological Notes
Zinc absorption — The Miller equation captures the saturable nature of zinc absorption: fractional absorption decreases at higher intakes while absolute absorption increases. Age-dependency reflects developing intestinal absorption capacity.
Iron absorption — The uniform 5% rate is conservative but appropriate for this population’s dietary patterns. Individual variation exists, but population-level estimates justify this approach for modeling purposes.
Chispitas contribution — Supplemental micronutrients are included in total intake before absorption calculations. The Miller equation was validated with MNP studies, supporting this approach.
Limitations
Mineral form differences: Absorption calculations do not account for potential differences in absorption of the mineral forms delivered through Chispitas (zinc gluconate, ferrous fumarate) and dietary sources.
Population heterogeneity: Uniform iron absorption may underestimate absorption for the small fraction of children with more diverse diets.
Application
The bioavailable nutrient estimates enable:
- Comparison against absorbed nutrient requirements (not just intake requirements).
- More accurate adequacy assessment for stunting risk modeling.
- Scenario modeling of biofortification impact on absorbed micronutrients.
References
Allen, L. H., Carriquiry, A. L., & Murphy, S. P. (2020). Perspective: Proposed Harmonized Nutrient Reference Values for Populations. Advances in Nutrition, 11(3), 469–483. https://doi.org/10.1093/advances/nmz096
Allen, L., de Benoist, Bruno, Dary, Omar, & Hurrell, Richard. (2006). Guidelines on food fortification with micronutrients. World Health Organization ; Food and Agriculture Organization of the United Nations.
Miller, L. V., Hambidge, K. M., & Krebs, N. F. (2015). Zinc Absorption Is Not Related to Dietary Phytate Intake in Infants and Young Children Based on Modeling Combined Data from Multiple Studies. The Journal of Nutrition, 145(8), 1763–1769. https://doi.org/10.3945/jn.115.213074